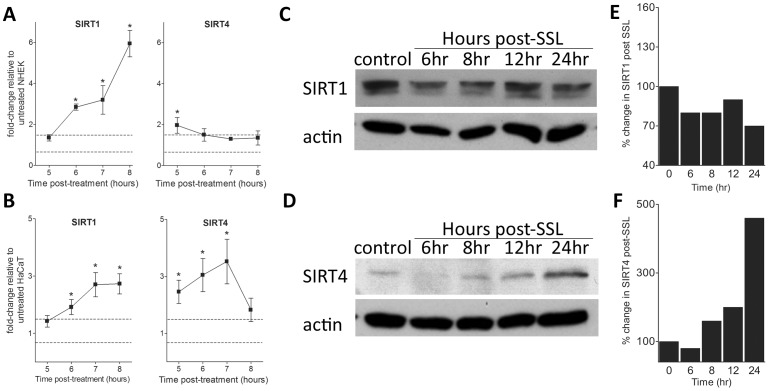
Figure 1. SIRT1 and SIRT4 gene and protein expression changes in NHEK and HaCaT cells following SSL treatment. (A–B).
Time course of SIRT1 and SIRT4 gene expression after SSL treatment was measured using qPCR. (A) NHEK cells (mean ± SEM, n = 2 independent experiments, each ran in triplicate). (B) HaCaT cells (mean ± SEM, n = 3 independent experiments, each ran in triplicate). Gene expression levels shown are expressed as fold-change relative to untreated cells, where all samples were normalized to GAPDH gene expression. *p<0.05 and a fold change >1.5 or <0.67 (dashed lines). (C) SIRT1 and (D) SIRT4 protein expression in NHEK cells was detected by Western blotting using the antibody described in Materials and Methods. To normalize for protein loading, blots were probed with an antibody against α-tubulin. (E) Percentage change in SIRT1 and (F) SIRT4 protein expression level relative to untreated NHEK after normalization to α-tubulin.

