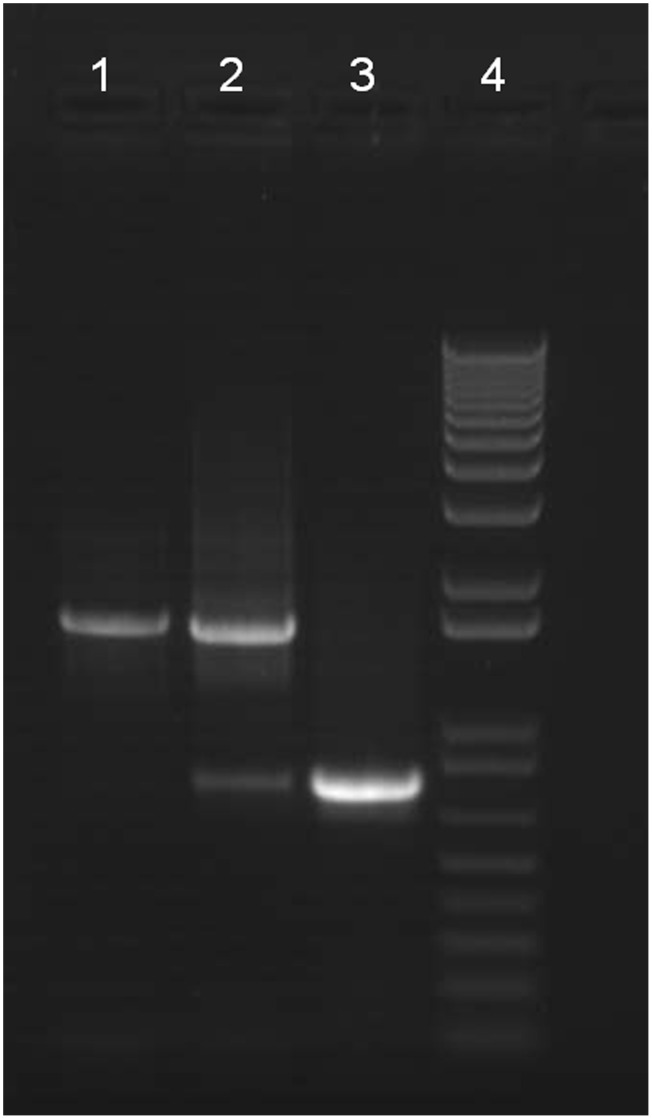
Figure 2. Gel electrophoresis analysis of nad5Δ mtDNA.
C. briggsae DNA samples were analyzed by PCR using primers flanking the nad5Δ locus. Resultant PCR products were subject to agarose gel electrophoresis and scored according to the PCR band genotypes described in the Results. Lane 1 shows a sampled scored as intact (large band only); lane 2 shows a sample scored as intermediate (both large and small bands); lane 3 shows a sample scored as deletion (small band only). Lane 4 shows the molecular marker (1 kb+ DNA ladder).

