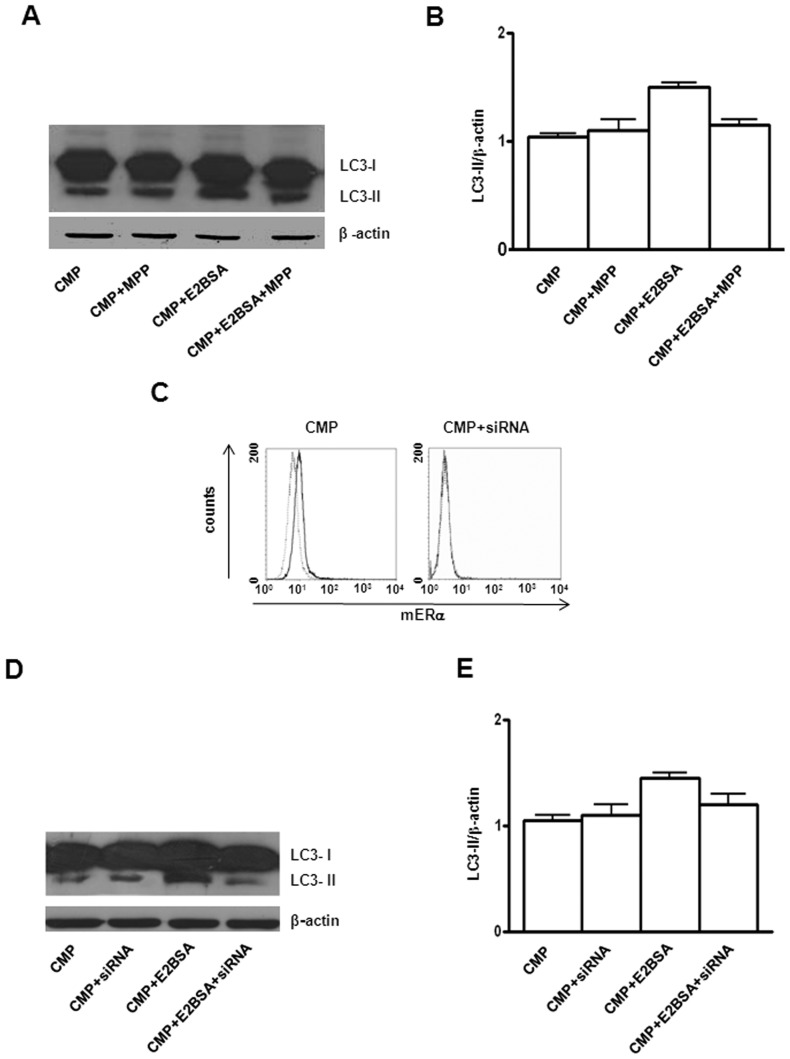
Figure 6. Effects of ERα inhibition and knockdown.
(A) Western blot analysis of LC3-II in CMP treated SH-SY5Y cells in presence or absence of E2BSA and ERα inhibitor MPP. Blot shown is representative of 3 independent experiments. (B) Densitometry analysis of LC3-II levels relative to β-actin is shown. Values are expressed as mean ± SD. (C) Flow cytometry analysis of cell surface mERα expression 48 h after siRNA transfection. Isotype control staining is represented by the dotted line and anti-ERα-labeled cells are represented by the solid line. A representative experiment out of three is shown. (D) Western blot analysis of LC3-II in CMP treated SH-SY5Y cells and in silencing CMP treated SH-SY5Y cells in presence or absence of E2BSA. Blot shown is representative of 3 independent experiments. (E) Densitometry analysis of LC3-II levels relative to β-actin is shown. Values are expressed as means ± SD.

