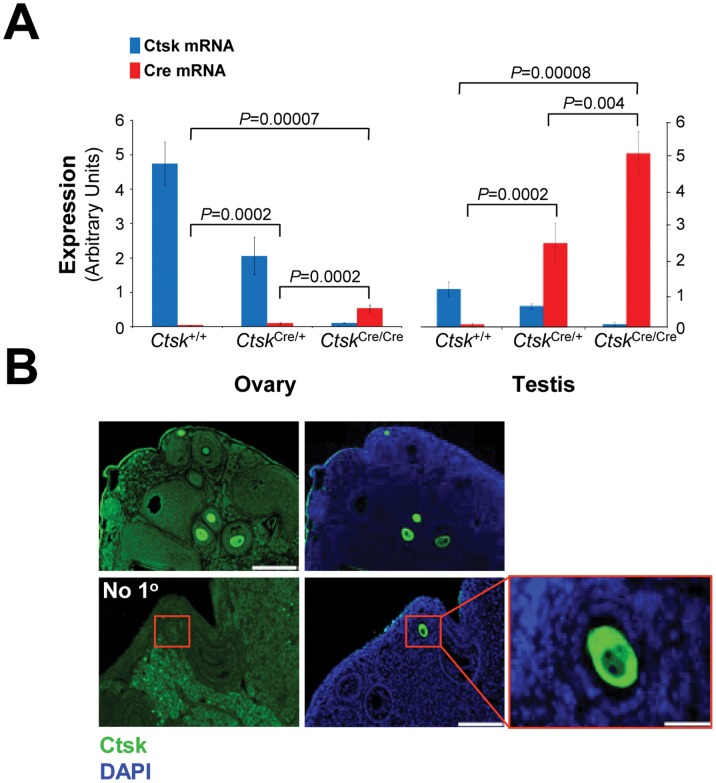
Figure 3. Cre is expressed in the gametes of CtskCre/+ mice.
(A) Real-time PCR was used to quantify the presence of Cathepsin K mRNA (blue) and Cre mRNA (red) in ovary (left) and testis (right) for all indicated genotypes (n = 3). Data are represented as means ± SD. A two-tailed t-test was used to generate indicated p values. (B) Ovaries from WT mice analyzed by IHC for Cathepsin K. Top panels, scale bar = 200 µM. Bottom, left panel shows staining without primary antibody. An adjacent section to the control (bottom, middle) was incubated with primary antibody (scale bar = 100 µM). Red box indicates positively-stained oocyte (bottom, right scale bar = 20 µM).

