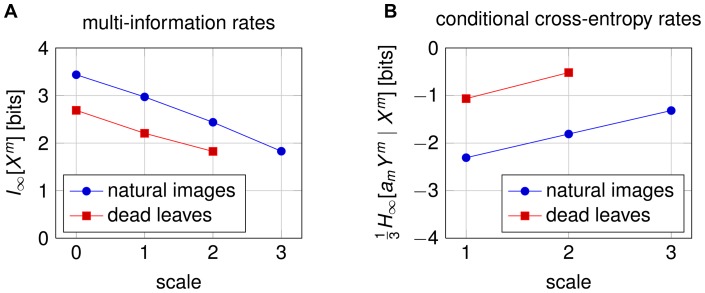
Figure 5. Multi-information and cross-entropy rates.
(A) The estimated multi-information rate decreases steadily as the scale increases (the resolution decreases). (B) The conditional cross-entropy rate increases with scale. The factor  corrects for the change in variance due to block-averaging and can be different for each scale
  . This shows that the van Hateren dataset [14] is generally not scale-invariant. A very similar behavior is shown by images created with an occlusion based model [17].

