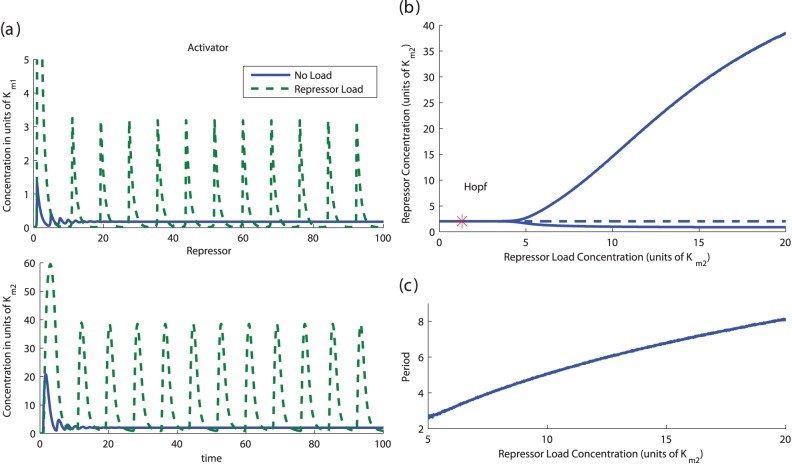
Figure 4. (a) Load to the Repressor triggers a Non-functional Clock.
The plots illustrate the trajectories of system (14) with two different amounts of load. The parameters in the simulation were  ,
,  ,
,  ,
,  ,
,  ,
,  ,
,  and
and  . The amount of DNA binding sites in the system with no load is
  whereas in the system with repressor load is
  . (b) Hopf Bifurcation with
  as a parameter. A continuation of the equilibrium as a function of the load parameter
  shows that, for this set of parameters, the amount of load required to activate the clock is in the same order of magnitude as that of the the affinity coefficient
  , with bifurcation occurring at
  . This plot was obtained via continuation of system (14) with the same parameters as before. Solid lines indicate a stable trajectory (limit cycle to the right of the Hopf bifurcation and the equilibrium to its right). The dotted line indicates an unstable equilibrium point. (c) Period increases as a function of the repressor load
  .
.

