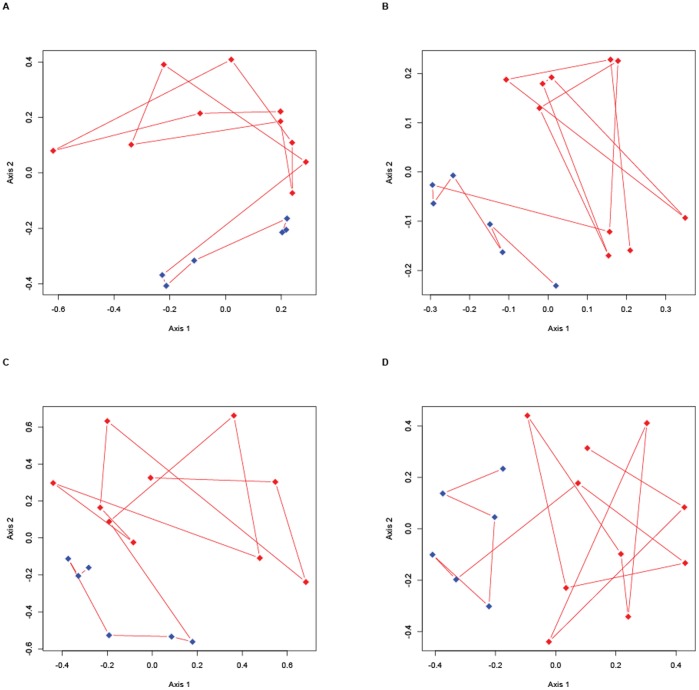
Figure 4. PCoA and NMDS.
PCoA (Fig. A and B) and MNDS (Fig. C and D) showing the representation of vectorial analysis of sequences found in feces of healthy horses (blue dots) and horses affected by colitis (red dots). Results were obtained using the Yue & Clayton measure (Fig. A and C), the Jaccard index (Fig. B and D).

