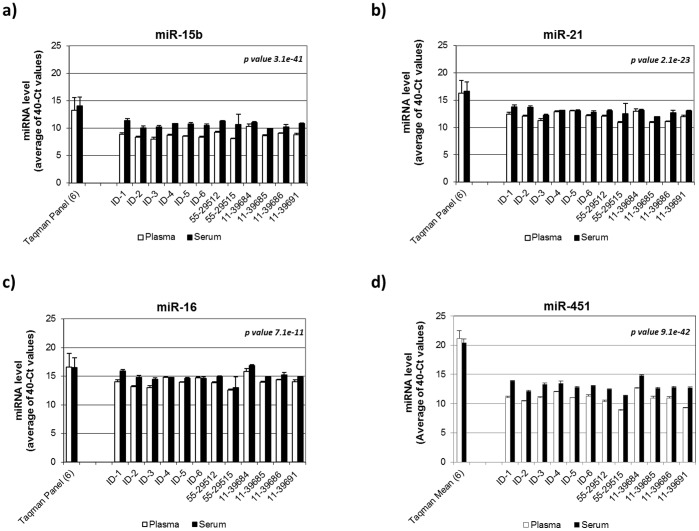
Figure 2. Examples of miRNA concentration differences between serum and plasma using individual Taqman QPCR primers.
The sample IDs were listed on the X-axis and the miRNA concentrations were displayed on the Y-axis (in 40-Ct value). The miRNA IDs were indicated on top of the graph. Open bars represent plasma samples and the solid bars represent the corresponding serum samples. The values of standard derivation were obtained from three independent measurements. The original measurement results from Taqman card showed higher 40-Ct values since a pre-amplification step was employed. Two-way ANOVA was used to determine the statistical significance of the miRNA concentration differences between serum and plasma (p-values are shown in the figure).

