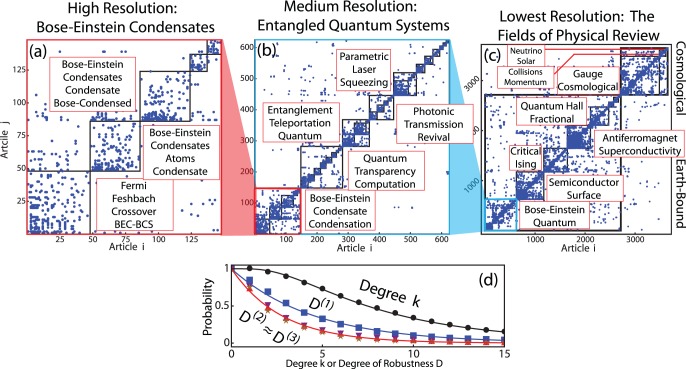
Figure 4. The hierarchical community structure of the Physical Review network.
a‐c shows a progressively coarsened view of the network, with the text labels of the communities composed of the most statistically significant words found in the titles of the articles in the communities. a shows the microcommunity structure of 148 nodes, with b a zoomed‐out picture of the 625 nodes in one macrocommunity of the second level of the hierarchy, and c the full network showing the final two levels of hierarchy. d shows the degree distribution as well as the distribution of node robustness at each level of the hierarchy shown log‐linear in the inset. Black circles show the degree distribution, which is log‐normally distributed [31] the best fit is the black line. The distribution of robustness on the micro‐scale,  , is shown with the blue squares, while the distribution for the other hierarchical degrees of robustness
  are all quite similar shown with the up triangles, down triangles, and stars. The initial decay of the robustness is well‐fit by an exponential in all cases with the best fit for each shown as lines.

