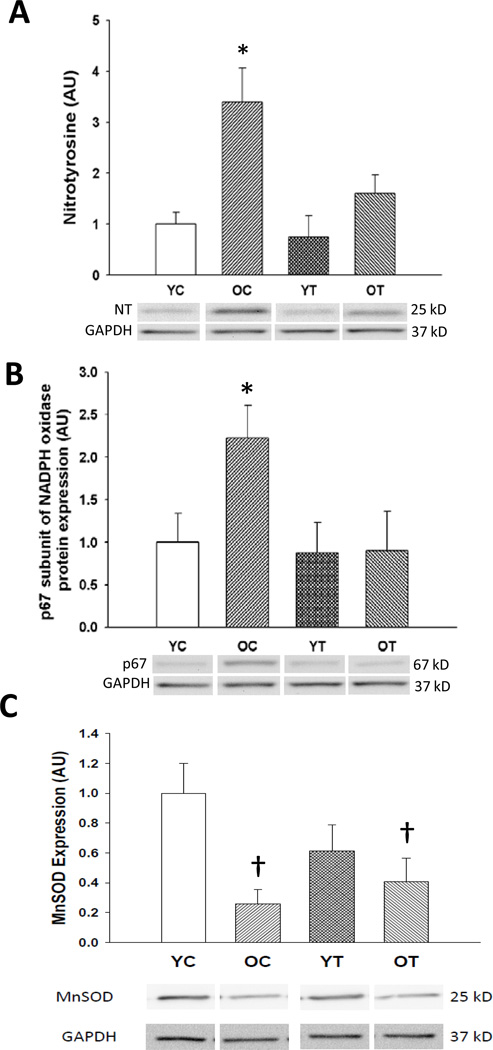
Figure 5. Oxidative stress.
(A) Nitrotyrosine abundance, (B) p67 subunit of nicotinamide adenine dinucleotide phosphate (NADPH)-oxidase (NADPH oxidase), and (C) manganese superoxide dismutase (MnSOD) in aorta of young and old control (YC and OC) and young and old TEMPOL-supplemented (YT and OT) mice. Data are expressed relative to GAPDH and normalized to YC mean value. Representative Western blot images below. Values are mean ± SEM. (n = 4–8 per group) * p < 0.05 for OC vs. YC, YT and OT. † p < 0.05 for OC vs. YC and OT vs. YC.

