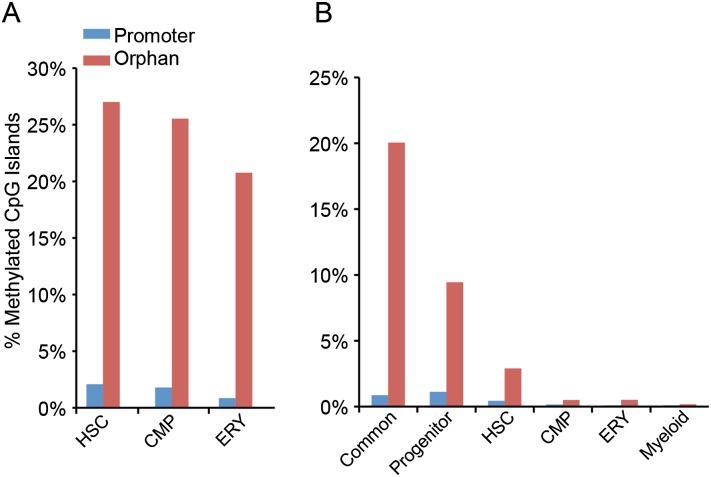
Figure 4.
Overlap of MBD-seq peaks with CpG islands. (A) MBD-seq peaks in the three cell types compared with the complete genomic CpG islands classified by Illingworth et al. (2010). The percent of methylated promoter CpG islands (blue) or orphan (non-promoter) CpG islands (red) is shown for each cell type. (B) Methylated promoter and orphan CpG islands in common and cell-type-specific peaks, as a percentage of total CpG islands.

