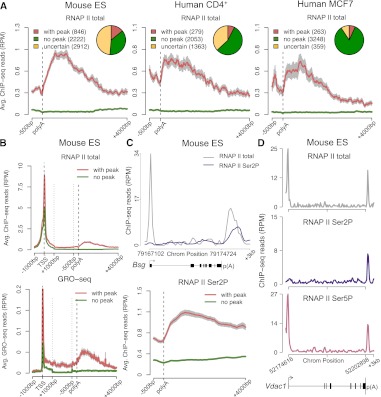
Figure 1.
Genome-wide identification of genes that accumulate RNAPII at the 3′ end. (A) Profiles of total RNAPII (Pol II) density on actively transcribed genes were analyzed using three peak calling methods (see Supplemental Fig. 1). The diagrams show numbers of genes with a consistent 3′ peak (detected by at least two methods), genes consistently devoid of 3′ peak (no peak detected by any of the three methods), and uncertain genes (genes with a 3′ peak detected by a single method) in murine ES cells, human CD4+ T, and MCF7 cells. Graphs depict average RNAPII profiles at the 3′-end of genes with (red) and without (green) peak. The 3′-end is unscaled. (B) Comparison of RNAPII ChIP-seq and Gro-seq average profiles across genes with (red) and without (green) peak in mouse ES cells. The 5′ end (TSS denotes transcription start site) and the 3′-end are unscaled. The remainder of the gene is rescaled to 2 kb. (C) Total RNAPII (gray) and Ser2P (purple) profile for a representative gene (Bsg) and average RNAPII Ser2P profiles at the 3′-end of genes with (red) and without (green) a 3′ peak of total RNAPII. Error bars (gray) represent standard error of the mean. (D) Total RNAPII (gray), Ser2P (purple), and Ser5P (pink) profile for a representative gene (Vdac1) with a peak of RNAPII Ser5P at the 3′-end. (RPM) Reads per million.

