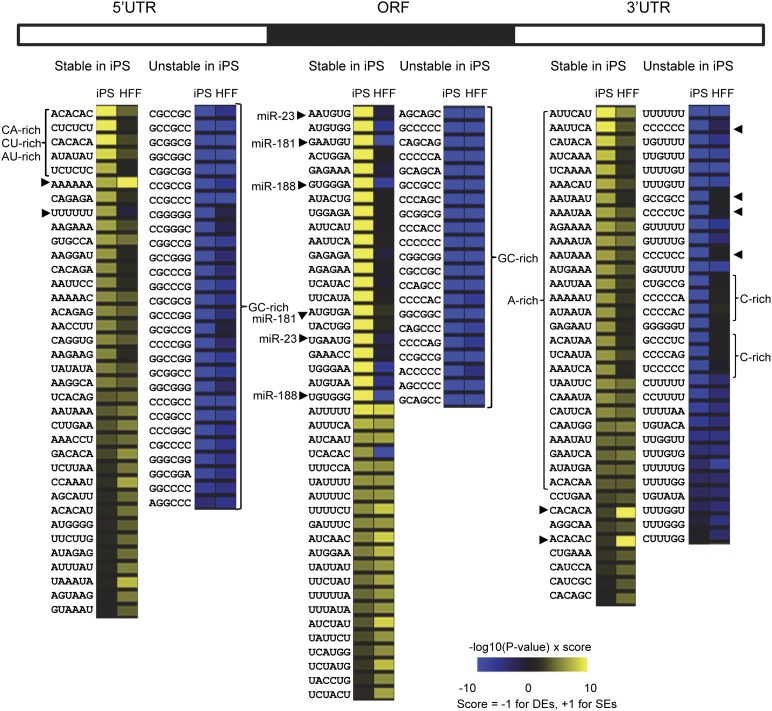
Figure 4.
Hexamers enriched in the 5′ UTR, ORF, and 3′ UTR of stable and unstable mRNAs. Occurrence of each possible hexamer in each region of the 548 most stable and 548 least stable mRNAs in iPS cells was determined. Hexamers were ranked as described in the Methods. Those that were over-represented in stable mRNAs (SEs) are depicted in yellow. Hexamers that were over-represented in unstable mRNAs (DEs) are shown in blue. The score for each hexamer in the set of stable and unstable mRNAs for HFFs was also determined, and the scores for iPS and HFF were compared. Specific elements of interest that might represent binding sites for RNA-binding proteins or miRNAs are indicated by arrowheads or brackets and are discussed in more detail in the text. The scores for all hexamers are shown in Supplemental Table 1.

