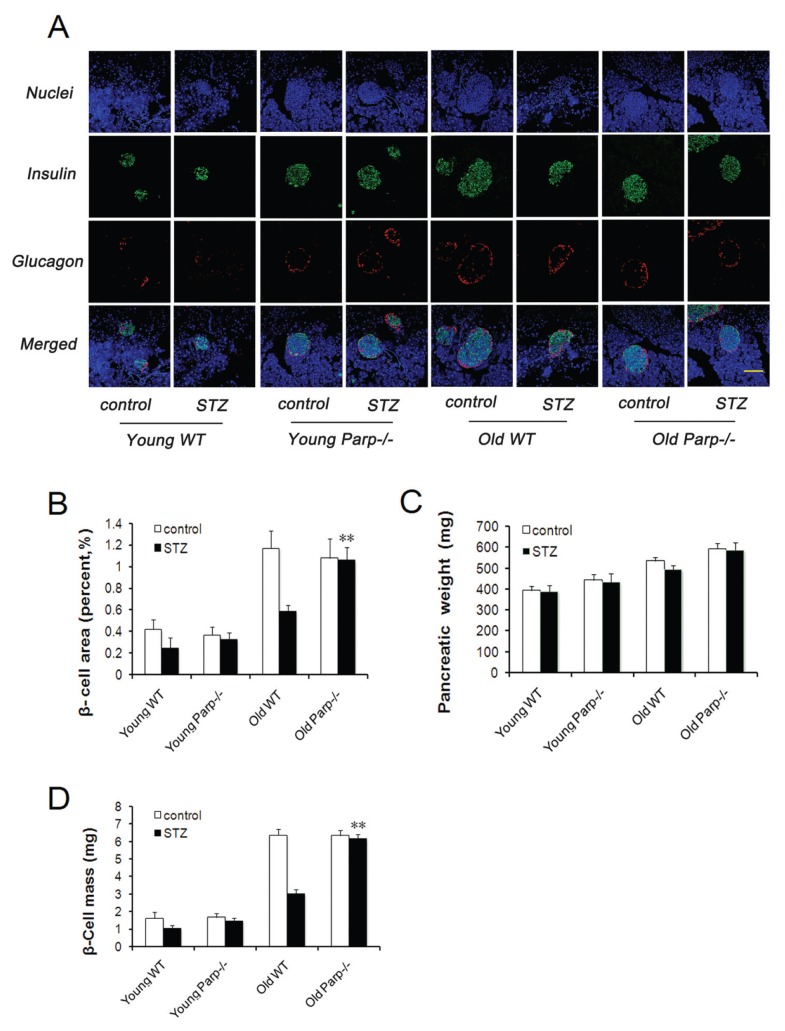
Figure 3.
Adaptive expansion of β-cell mass in young and old mice. (A) Immunofluorescence analysis of representative images of pancreatic sections from young and old mice before and after low-dose STZ treatment and stained with antiinsulin (green) and anti-glucagon (red) antibodies. Results are representative of 5–6 sections of the whole pancreas of each mouse (n = 4–5). (B) Quantification of the insulin-expressing cell area in the pancreas of young and old mice before and after low-dose STZ treatment (n = 4–5). **p < 0.01 versus old WT mice. (C) Pancreas weights of WT and PARP-1−/− mice before and after low-dose STZ (n = 9–12). (D) β-cell mass calculated by β-cell area and pancreas weight (n = 9–12). **p < 0.01 versus old WT mice. Bar = 100 μm.

