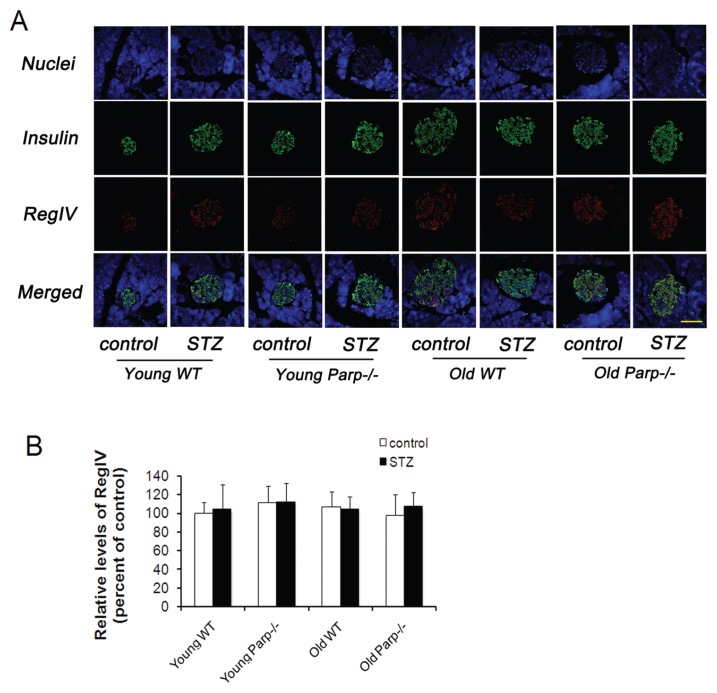
Figure 8.
RegIV levels in the pancreas of young and old WT mice and PARP-1−/− mice before and after low-dose STZ treatment. (A) Double staining for insulin (green) and RegIV (red), counterstained with DAPI (blue) (n = 4–5). Bar = 50 μm. (B) Quantitative analysis of RegIV protein expressed as fold increase over the control group (young WT mice before low-dose STZ treatment) (n = 5).

