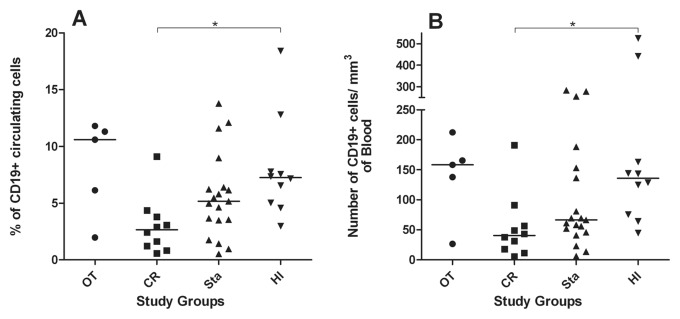
Figure 2.
Quantitative analysis of total circulating B cells in the study groups. CR individuals display lower frequencies (A) and absolute numbers (B) of B cells in relation to HI. The absolute cell numbers were calculated on the basis of the complete blood count of each individual performed at the same moment of study sample. OT group, n = 5; CR group, n = 10; Sta group, n = 19; HI group, n = 10. *p < 0.05.

