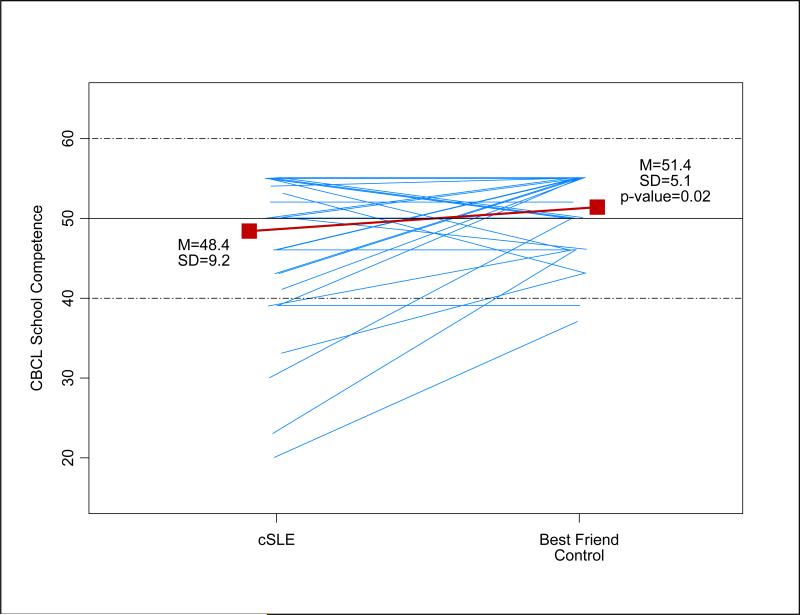
Figure 1. Plots of CBCL School Competence t -scores between cSLE's and paired best friends (controls).
Each blue line represents a cSLE-best friend pair; a red solid square represents the sample mean; the horizontal solid line represents the normative mean; and two doted lines represent ±1 normative standard deviation (SD) from the normative mean.

