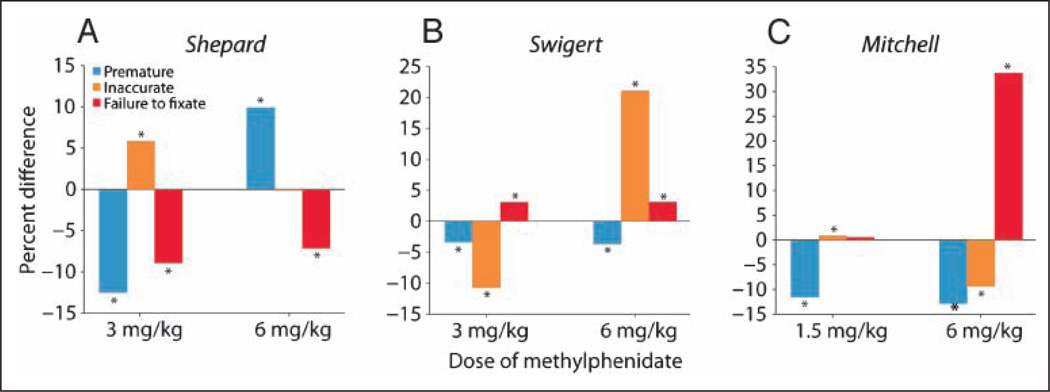
Figure 5.
Breakdown of error types by subject. Percent difference from control of the three error types for each subject (A–C, see Methods and Results for details). Premature response, blue; inaccurate response, yellow; failure to fixate, red. Significance at p = .05 evaluated using a binomial test, *p < .0005; Shepard, 6 mg/kg inaccurate, p = .15; Mitchell, 1.5 mg/kg failure to fixate, p = .986 (two-tailed).

