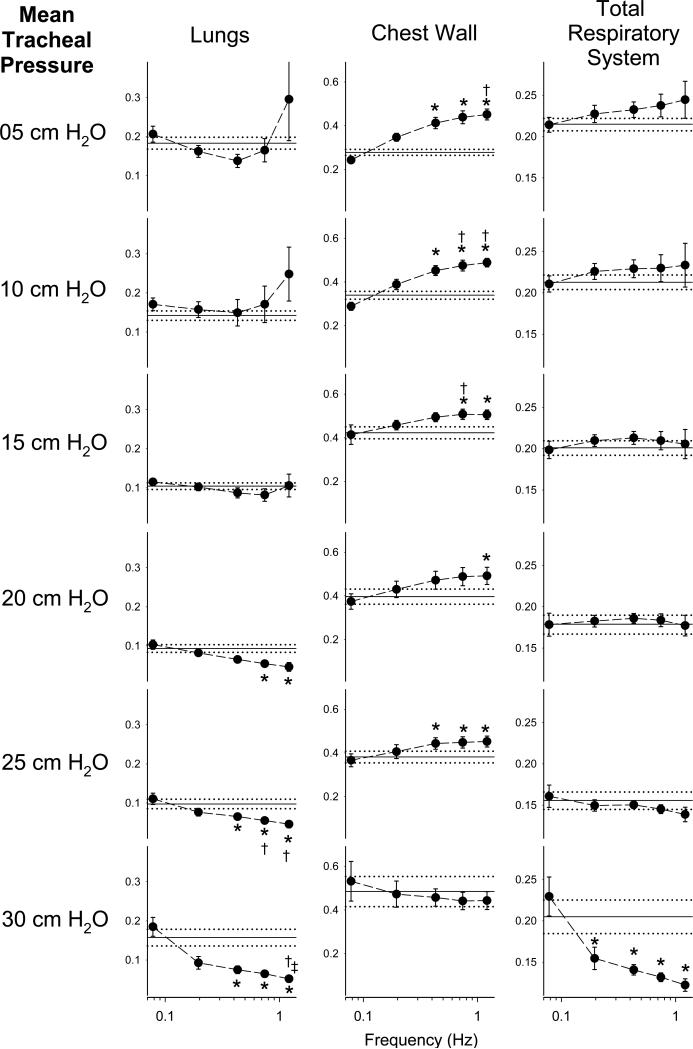
Figure 6.
Hysteresivity (η) versus frequency as computed according to Equation 8. Data are expressed as the averages across twelve dogs. Vertical error bars, when larger than the symbol, denote standard errors of the corresponding mean value of η. Solid horizontal lines denote the average model-based estimate of η obtained from Equation 3, while the dotted horizontal lines denote the standard error of the model parameter averaged across all dogs. *Significantly different compared to value of η at 0.0781 Hz; †Significantly different compared to value of η at 0.1953 Hz; ‡Significantly different compared to value of η at 0.4297 Hz. Statistical comparisons obtained using Friedman ANOVA and Tukey HSD test at the P < 0.05 level.

