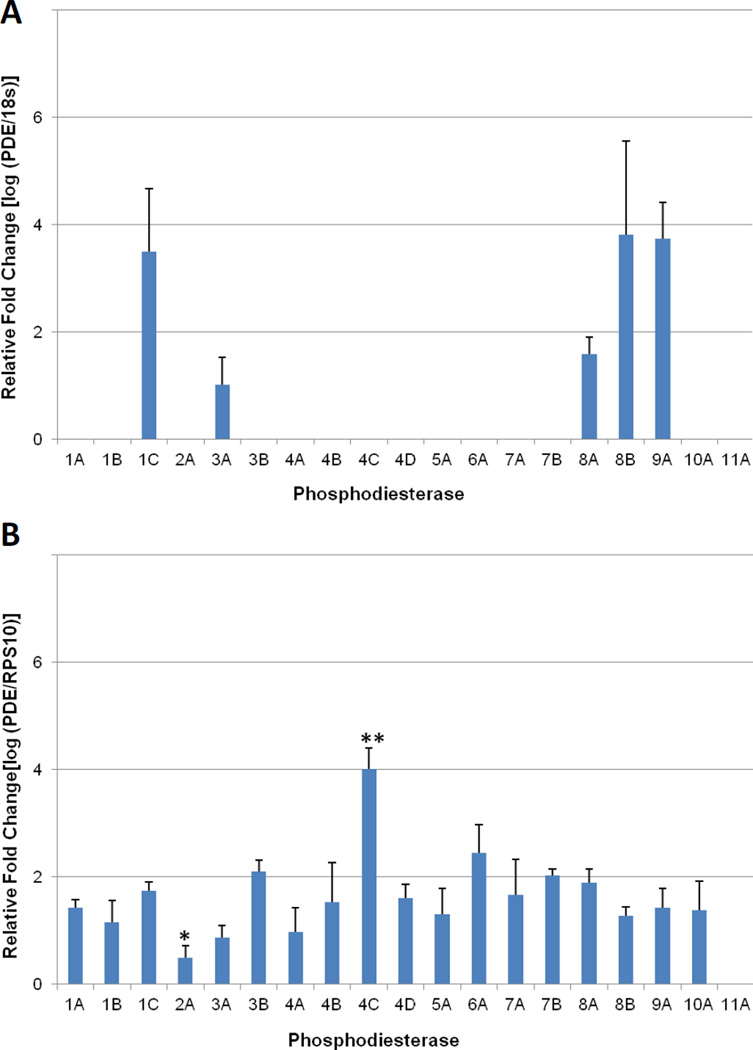
Figure 1.
Quantitative PCR (qPCR) profiling of PDE expression in rhesus monkey GV oocytes and granulosa cells collected from pre-ovulatory antral follicles. (A) Of the 19 PDE genes that were assayed, only PDE1C, PDE3A, PDE8A, PDE8B, and PDE9A were detectable in the GV oocyte. (B) PDE expression in granulosa cells, PDE11A was the only isoform not detectable in any of the samples evaluated. Expression ratios are based on a comparison to the endogenous control gene; 18s-rRNA for oocytes and RPS10 for granulosa cells. Error bars indicate standard deviation. One Way ANOVA was performed with a Student-Newman-Keuls post hoc test to determine significant changes in expression with P < 0.001. * Indicates expression is significantly less than all other isoforms. ** Expression is significantly greater than all other isoforms.

