
Figure 9. PECAM-1 surface localization is increased in response to CCL2.
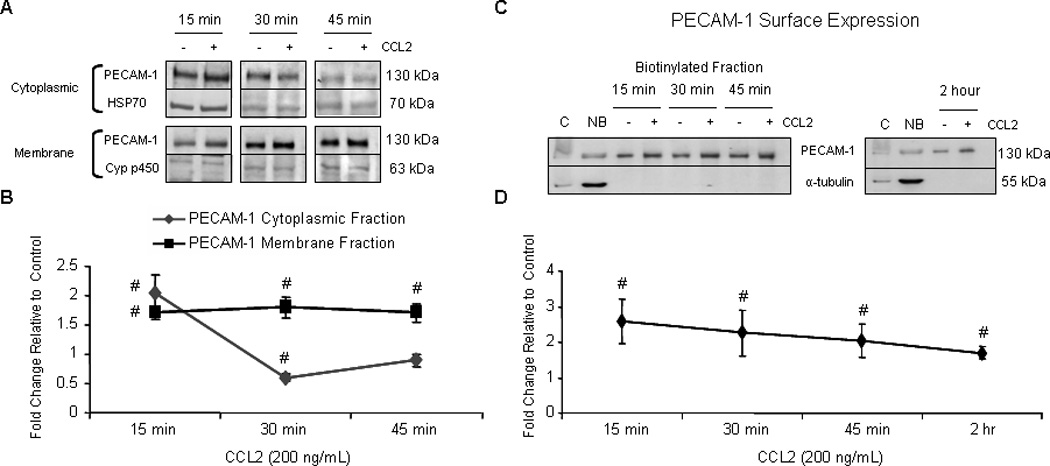
Confluent primary HBMVEC were exposed to 200 ng/mL CCL2 or diluent. (A and B) Cytoplasmic, membrane, nuclear, and cytoskeletal fractions were isolated using different buffer systems. 10 µg of total protein from each fraction was evaluated by Western blot. PECAM-1 was quantifiable in cytoplasmic and membrane fractions. Optical density of PECAM-1 was compared to OD of loading control specific to each fraction. Densitometry is reported as fold change in CCL2-treated cells relative to control cells at the same time point. Blots are representative of 3 independent experiments. (#) p < 0.01. After 15, 30, and 45 minutes of CCL2 treatment, PECAM-1 localization to the membrane compartment is increased. (C–D) After treatment with either CCL2 or diluent, cell surface proteins were biotinylated, immunoprecipitated with streptavidin conjugated to agarose beads, and evaluated by Western blot. Optical densities of PECAM-1 from CCL2-treated cells were compared to vehicle-treated cells from same time point. Densitometry is reported as fold change in CCL2-treated cells relative to control. Immunoreactivity of non-biotinylated, but not biotinylated fraction, to α-tubulin demonstrates that only surface proteins were biotinylated. C = control lysate. NB = non-biotinylated fraction. n=3. (#) p < 0.01. CCL2 induces PECAM-1 mobilization to the cell surface by 15 minutes and is maintained for at least 2 hours.