
Figure 2. Detection of primary/metastatic tumors with FAM-PG26.
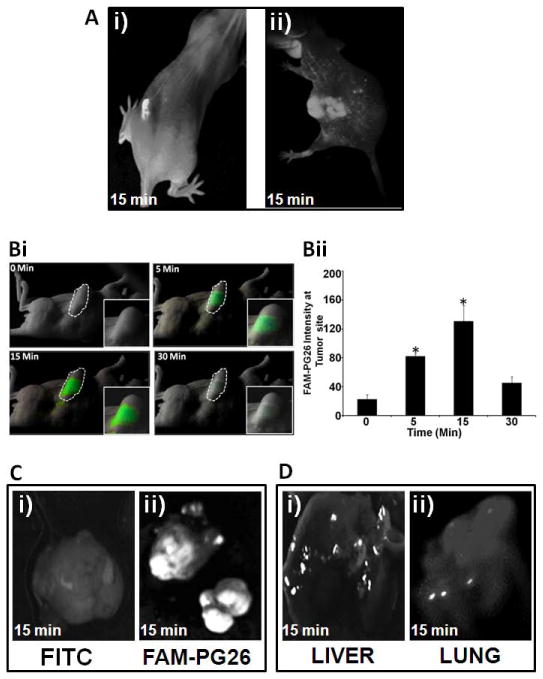
Fluorescense detection of FAM-PG26 in tumors derived from HEKmGAS (Ai,B,C,D) and HCT-116 (Aii) cells. FAM-PG26 was injected either intratumorally (Ai) or in tail veins (Aii,B,Cii,D). Images were taken after indicated time-points either in intact anesthetized mice (A,B) or after resection of tumors/tissues(C,D). (B)=Time-dependent uptake of FAM-PG26 by sub-dermal tumors. Bi= fluorescent images from a representative mouse; Bii=Mean±Sem of relative fluorescence intensity at tumor site from 3 mice (described in Supplementary-Methods E). *=p<0.05 vs 0min values. (Ci,Cii)=sub-dermal tumors from mice injected with either FITC (Ci, control) or FAM-PG26 (Cii). (D)=liver/lung samples containing metastatic-lesions from mice injected with FAM-PG-26.