
Figure 4. Expression of stem-cell-markers and ANXA2/CS-ANXA2 in HEKmGAS/HEKC-cells.
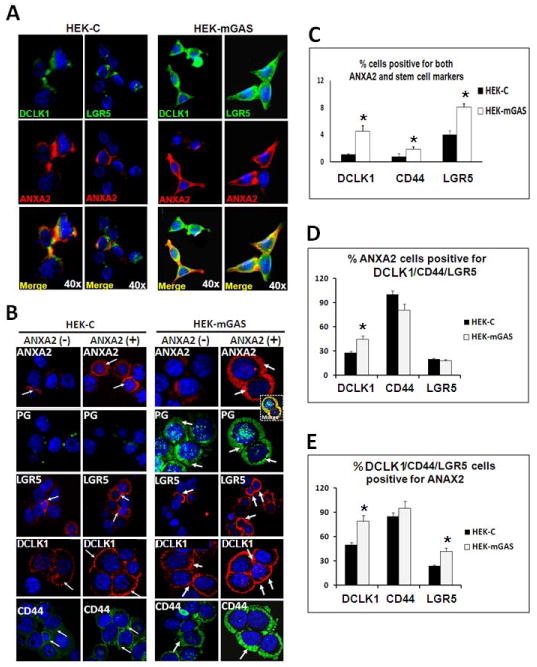
A=Representative images of cells growing on cover-slips (Method II), stained for indicated proteins. B=Representative images of cells (from 2–3 experiments), FACSorted for ANXA2(−)/ANXA2(+) populations after staining for the indicated proteins; images from a wider field shown in Supplementary-Fig 4. Co-localization of ANXA2/PG in CS-ANXA2(+)HEKmGAS cells is shown in inset (yellow image). Arrows highlight staining. C–E=% cells co-expressing ANXA2 and the indicated stem-cell-markers were calculated as described in Supplementary-Method (G); results are presented as Mean+Sem from 2–3 experiments. *=p<0.05 vs HEKC values.