
Figure 6. A,B. Percent increase in relative levels of stem-cell-markers, β-catenin/pNFκBp65, ANXA2/PG and PCNA in monolayer-cultures (M), 3D-spheroids (S) or sub-dermal tumors (T) of HEKmGAS vs HEKC-cells.
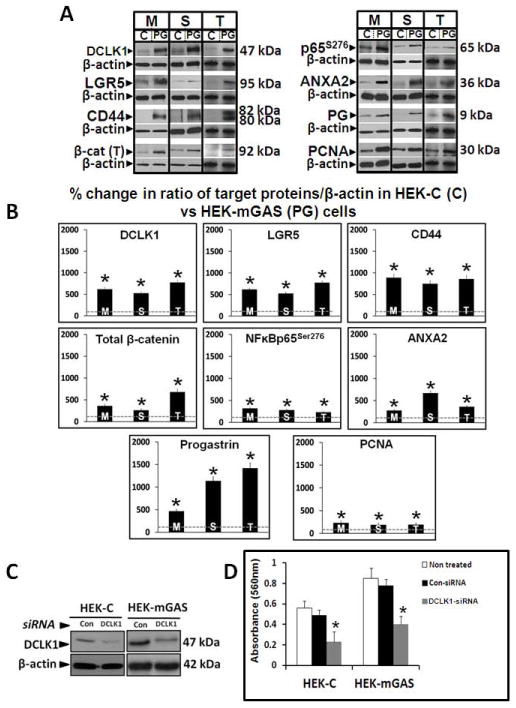
A=Representative WBs of indicated proteins from 1 of 3 similar experiments; C=HEKC-cells; PG=HEKmGAS-cells. B=Mean±Sem of % change in ratio of indicated protein/β-actin in cellular samples from 3 experiments; ratios measured in HEKC samples were arbitrarily assigned 100% values. *=p<0.05 vs HEKC values (shown as dashed lines in each panel). β-cat (T)=total cellular levels of β-catenin. Figures 6D,C. Down-regulation of DCLK1 significantly reduces growth of HEKC/HEKmGAS cells. C=representative autoradiogram of WB data from 1 of 3 experiments, demonstrating relative levels of DCLK1 in cells treated with either control (Con) or DCLK1 specific siRNA; β-actin run as a loading control. D=growth (in terms of absorbance in an MTT assay) of indicated cells; each bar-graph=Mean±Sem of data from 8 wells/2experiments.