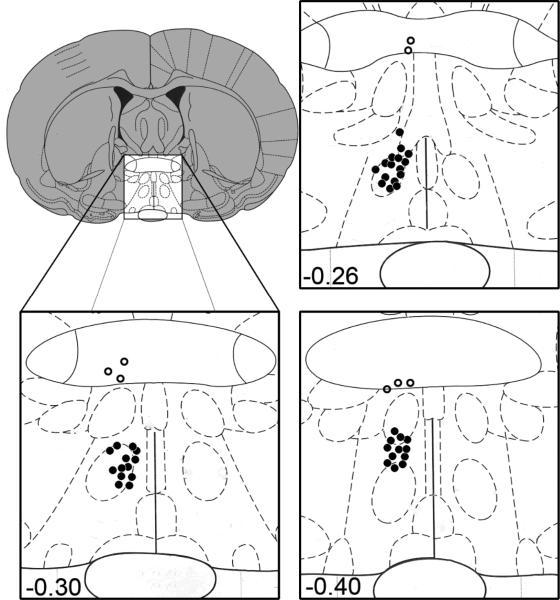
Figure 1.
Diagram illustrating the site of injection at the level of the MPOA (bregma, -0.26,-0.30,-0.40). Filled circles indicate correct placements and open circles represent missed placements outside the MPOA. From The Rat Brain in Stereotaxic Coordinates (4th ed.), figs. 18-20, by G. Paxinos & C. Watson, 1998, San Diego: Academic Press. Copyright 1998 by Elsevier Academic Press. Adapted with permission.

