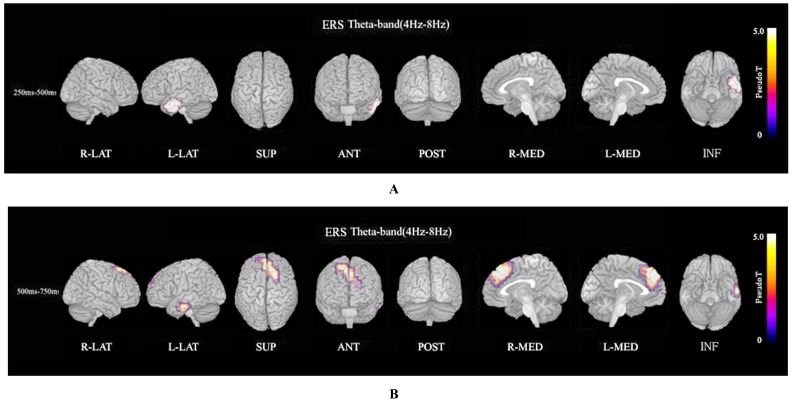
Fig. (3).
Theta ERS. (A). Functional maps of ERS power in the theta band (4–8 Hz) during the oddball task show statistical differences between patients with schizophrenia and normal controls. Theta ERS at 250–500 ms in patients was significantly increased in the left temporal pole during oddball task (FWE p<0.05). (B). Theta (4–8 Hz) ERS power at 500–750ms in patients was significantly increased in midline frontal and anterior portion of anterior cingulate cortex regions in both hemispheres, and left portion of lateral temporal regions during the oddball task (FWE p<0.05).

