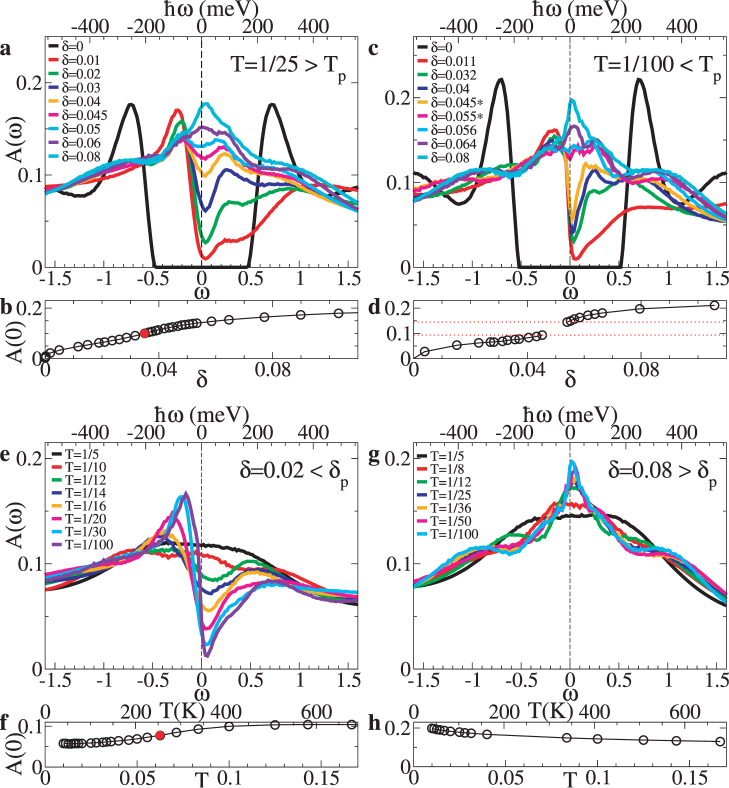
Figure 2. T* from density of states.
(a,c,e,g), A(ω) at U = 6.2 obtained from maximum entropy analytic continuation of continuous-time quantum Monte Carlo data. (a,c), A(ω) for different dopings at fixed temperature, (a) T = 1/25 > Tp and (c ) T = 1/100 < Tp respectively. In the latter case, associated with the first-order transition at finite doping there are hysteresis effects in the T – µ plane, where the transition appears as a coexistence interval between two metallic phases. Orange and magenta lines are A(ω) obtained in the coexistence region: they have the same chemical potential µ = −0.725, but different filling and different low-energy spectrum, one with a pseudogap and the other one with a rather broad peak at ω = 0. (e,g), density of states at fixed doping for various temperatures. (e) is for δ = 0.02 < δp, where a pseudogap opens up with decreasing temperature. (g) is for δ = 0.08 > δp where a pseudogap is absent and a narrow peak develops as T decreases. (b,d,f,h), density of states at the Fermi level A(ω = 0) as a function of doping or temperature. Here, data are obtained from the extrapolated value of the imaginary part of the local cluster Green's function −1/πImG(ωn → 0), which does not require analytical continuation. The inflection point of these curves as a function of µ or T, indicated by a red circle, is our estimate of T*. On the upper horizontal axis we convert into physical units by using t = 0.35 eV.

