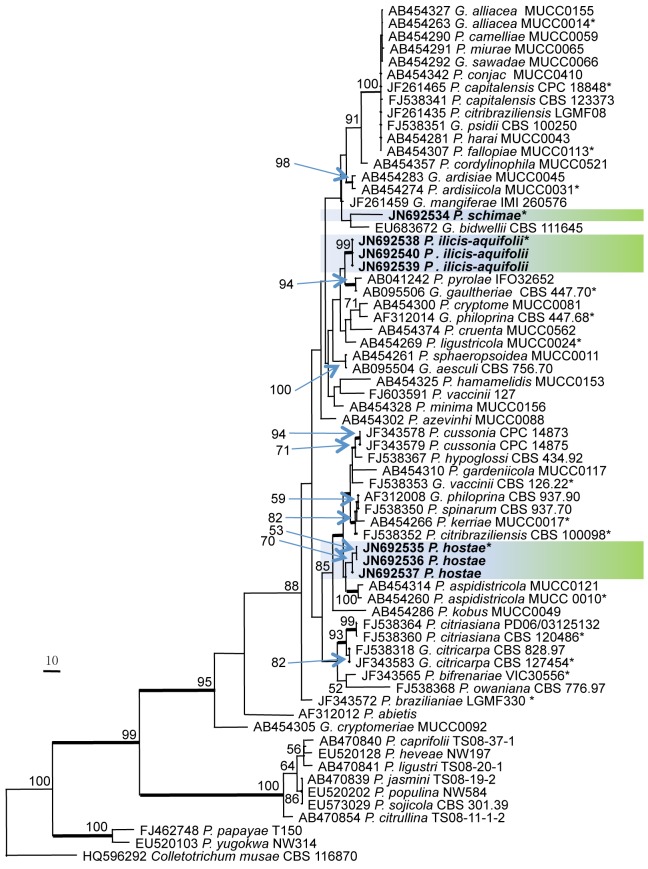
Fig. 1.
Phylogenetic tree generated from a maximum parsimony analysis based on the ITS nrDNA sequence alignment. Values above the branches represent parsimony bootstrap support values (> 50 %). Thickened branches represent significant Bayesian posterior probability values (≥ 95 %). Novel sequences are printed in bold and the scale bar indicates 10 changes. The tree is rooted to Colletotrichum musae. An asterisk (*) indicates the ex-type strains.

