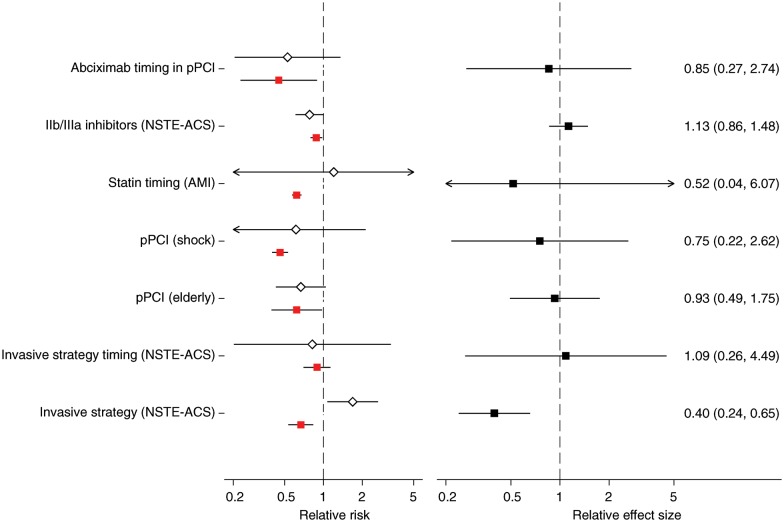
Figure 3.
(A) Relative risks from randomized controlled trials (white diamonds) and observational studies using propensity score methods (red squares), reporting on short-term mortality. (B) Corresponding relative effect sizes (black squares) comparing the relative risks from randomized trials and observational studies using propensity score methods. Layout is similar to Figure 2. Arrows indicate lower or upper bounds of confidence intervals that were outside the plotted range of values. See Supplementary material online, Table S1 for detailed study-level information. Please see Table 1 for abbreviation definitions.

