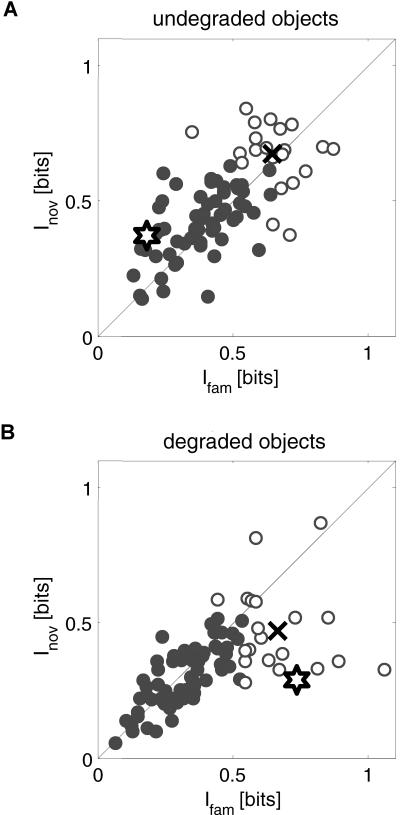
Figure 3. Learning Led to an Increase in V4 Neural Information about Degraded but Not Undegraded Stimuli.
Here we summarize how much information V4 neurons communicated about novel (Inov) and familiar (Ifam) stimuli for undegraded (A) and degraded (B) stimuli. Each symbol in the scatter plot represents a single neuron and shows how much information this neuron communicated about familiar (x-axis) and novel (y-axis) stimuli. In each scatter plot, white-shaded symbols represent the 25% most informative neurons, i.e., the one-quarter of the population communicating most information about either familiar or novel stimuli. The remaining three-quarters of the population are shown in gray shading. The single neuron example in Figure 5 is represented by the star. The black ‘x' represents the population mean for the 25% most informative neurons.

