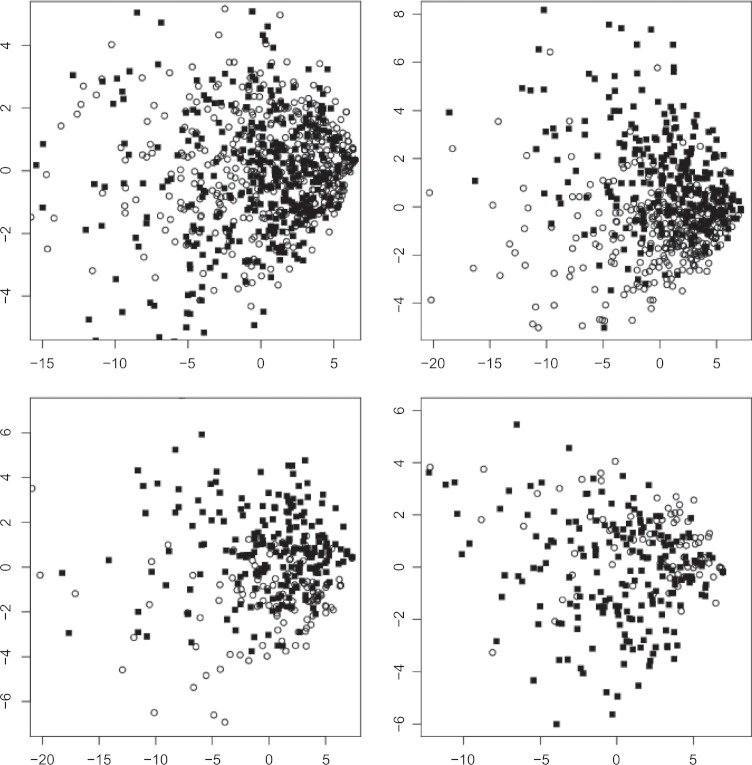
Figure 2.
Visualizing samples in 2-dimensions: annotated (black squares) vs. not annotated (white discs), upper left corner (random 20% of total data); subjective (white discs) vs. objective (black squares), upper right corner (random 33% of total data); positive (white discs) vs. negative (black squares), lower left corner (random 33% of total data); information (white discs) vs. instructions (black squares), lower right corner (random 33% of total data).

