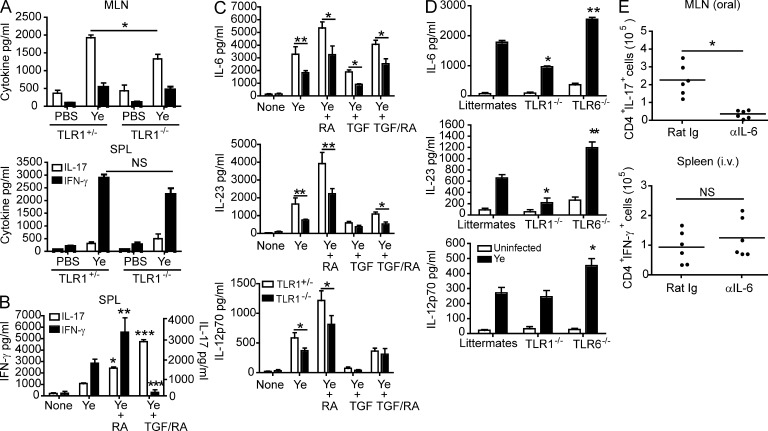
Figure 3.
TLR1-dependent IL-6 is critical for inducing TH17 cells during oral infection. (A) Levels of IFN-γ and IL-17 from co-cultures of naive SPL CD4+ T cells and MLN or SPL DCs from TLR1+/− or TLR1−/− mice stimulated with 10 µg/ml Y. enterocolitica lysate (Ye). Data shown are the mean ± SEM (n = 5) from two individual experiments. *, P < 0.05 (unpaired Student’s t test). (B) Levels of IFN-γ and IL-17 from co-cultures of SPL DCs and CD4+ T cells as described in A but with the addition of 10 µM RA or 2 ng/ml TGF-β and RA. *, P < 0.05; **, P < 0.01; ***, P < 0.05 (unpaired Student’s t test) compared with Y. enterocolitica treated. (C) Levels of IL-6, IL-23, and IL-12p70 from TLR1+/− (open bars) and TLR1−/− (closed bars) SPL DCs treated with Y. enterocolitica lysate plus RA, TGF-β, or RA/TGF-β. *, P < 0.05; **, P < 0.01 (unpaired Student’s t test) comparing TLR1+/− and TLR1−/− for each treatment. (D) Levels of IL-6, IL-23, and IL-12p70 in the MLNs from TLR1+/− or TLR6−/− mice 3 d after infection. *, P < 0.05; **, P < 0.01 (Student’s t test comparing infected knockouts with infected littermates). (B–D) Data are the pooled mean ± SEM (n = 6) from two individual experiments. (E) Total CD4+IL-17+ cells in MLNs of orally infected mice and total CD4+IFN-γ+ cells in the SPLs of i.v. infected mice as determined by flow cytometry. Data are pooled from two individual experiments (n = 6). Horizontal bars represent the mean. *, P < 0.05 (paired Student’s t test).

