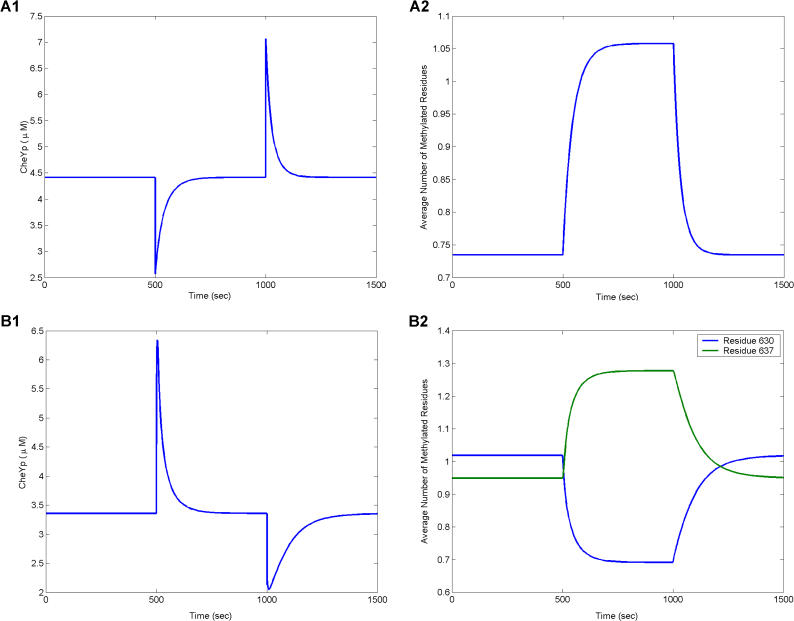
Figure 4. Simulation of Adaptation in E. coli and B. subtilis .
Attractant (10 μM) is added at 500 s and removed at 1,000 s.
(A) Timecourse simulation of phosphorylated CheY (left) and receptor methylation (right) in E. coli.
(B) Timecourse simulation of phosphorylated CheY (left) and receptor methylation (right) in B. subtilis. In both species, adaptation correlates with changes in receptor methylation.

