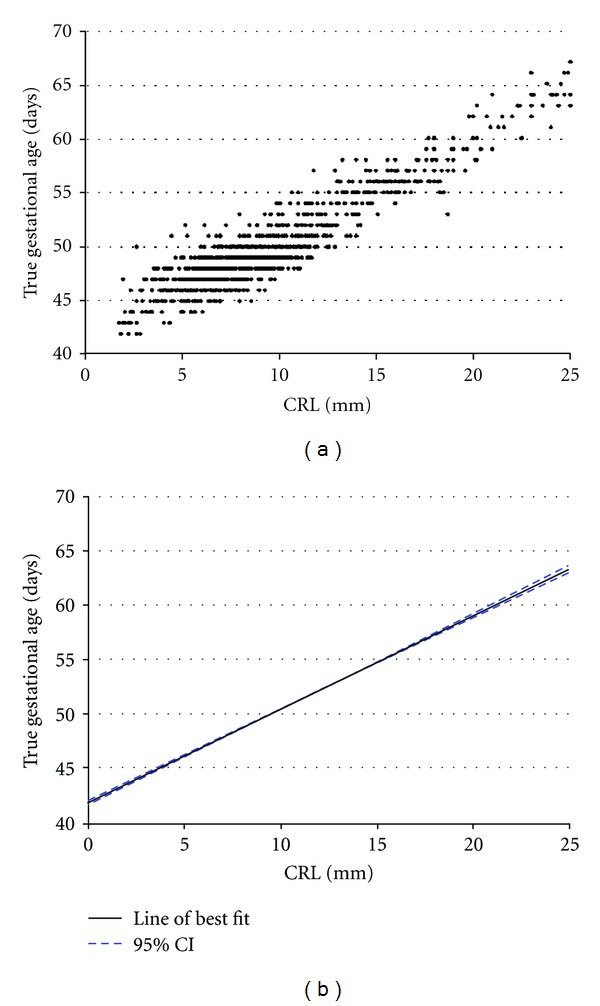
Figure 1.

(a) scatterplot and (b) line of best fit (black line shows line of best fit, and blue line shows ±95% confidence interval) to describe CRL length graphed against “true” gestational age (calculated from date of conception in the IVF singleton cohort). n = 1268.
