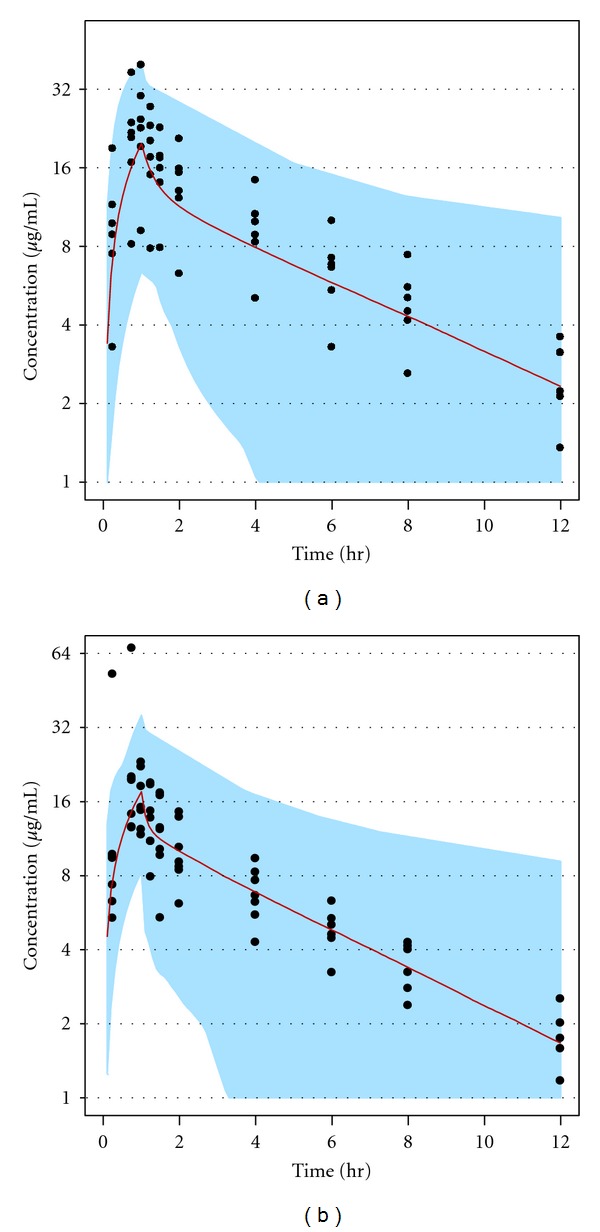
Figure 1.

A representation of the inflated variance (40% CV) for between-subject variability in pharmacokinetic parameters. The (a) and (b) panels represent CVVH and CVVHDF data, respectively, from a previously published study [14]. The filled circles are observed study data and the lines and shaded areas represent the median and range, respectively, of minimum and maximum simulated concentrations.
