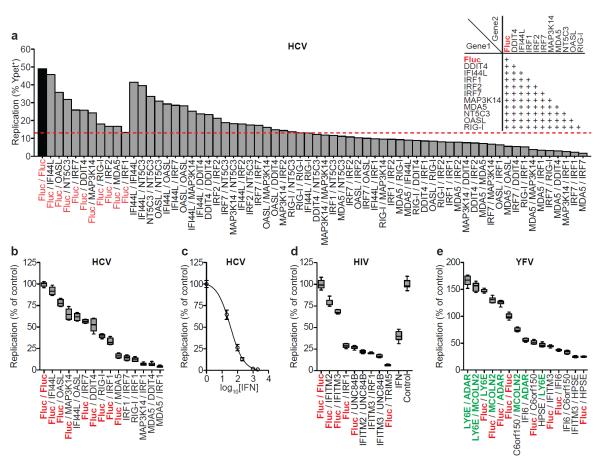
Figure 3. Combinatorial action of inhibitory and enhancing ISGs.
a. Anti-HCV ISGs were tested in 2-gene combinations (inset). Dashed red line denotes the strongest single-gene inhibitor, IRF1. b, d, e. Confirmation assays from two-gene screens for HCV (b), HIV(d), YFV(e). Data were normalized to Fluc control. n=8 for HCV, YFV, n=9 for HIV. Statistical significance was determined by one-way ANOVA. (***,P<0.001, **,P<0.01, *,P<0.05, ns-not significant). Inhibition of HIV IFNα is plotted for comparison. ISGs are color-coded: control (red), inhibitory (black), enhancing (green) c. Inhibition of HCV by IFNβ. Results are mean ± s.d., n=3.

