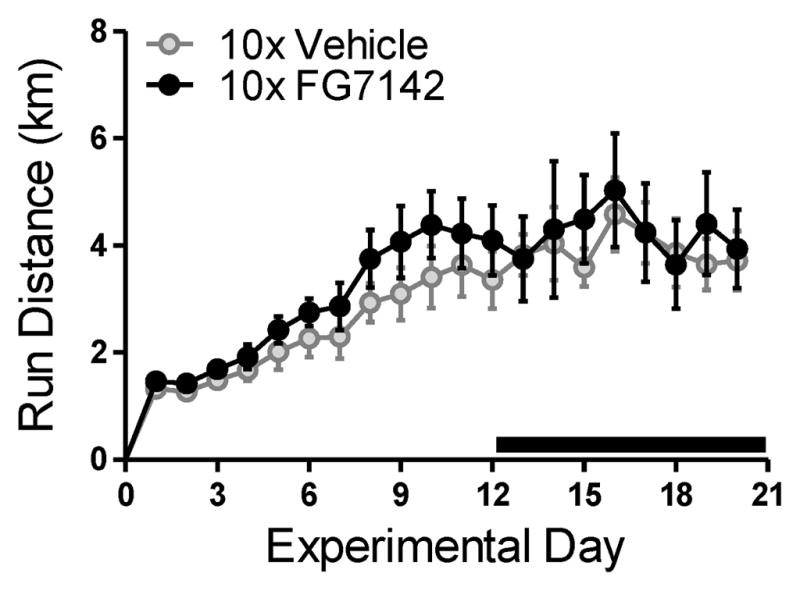
Figure 1. Daily distance ran in a running wheel increased across experimental days in a similar manner for all treatment groups.

Note that the bold line indicates the experimental days on which repeated (10x) injections of vehicle or FG7142 occurred. Data are mean ± SEM (n = 9–10).
