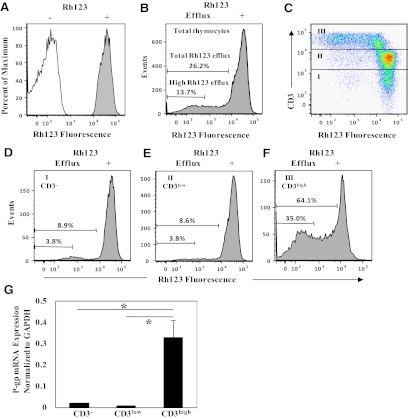
Figure 1. Rh123 efflux and P-gp mRNA expression in CD3–, CD3low, and CD3high thymocytes.
(A) The open and filled histograms represent autofluorescence in thymocytes prior to Rh123 loading and uptake-fluorescence in Rh123-loaded thymocytes, respectively. (B) Histogram shows Rh123 efflux in live-gated total thymocytes. High efflux was defined as fluorescence intensity equivalent to unloaded cells, and total efflux was defined as the fluorescence intensity shift following Rh123 loading. (C) Rh123 versus CD3 fluorescence in live-gated thymocytes is shown by dot plots. Rh123 efflux and cell surface-staining with mAb were performed as described in Materials and Methods. Fractions I, II, and III indicate CD3–, CD3low, and CD3high thymocyte populations, respectively. (D–F) Rh123 efflux in the CD3–-, CD3low-, and CD3high-gated thymocytes is shown by histograms. The numbers in the histograms show the proportions of total and high efflux in each cell subset. Similar results were obtained in three independent experiments. (G) qRT-PCR for P-gp mRNA expression in CD3–, CD3low, and CD3high thymocytes. Thymic single-cell suspensions were sorted for CD3–, CD3low, and CD3high thymocytes. The expression levels of P-gp were quantified by real-time PCR and normalized to the corresponding GAPDH levels as described in Materials and Methods. Bars represent mean values ± sd of three separate experiments. (*P<0.05).

