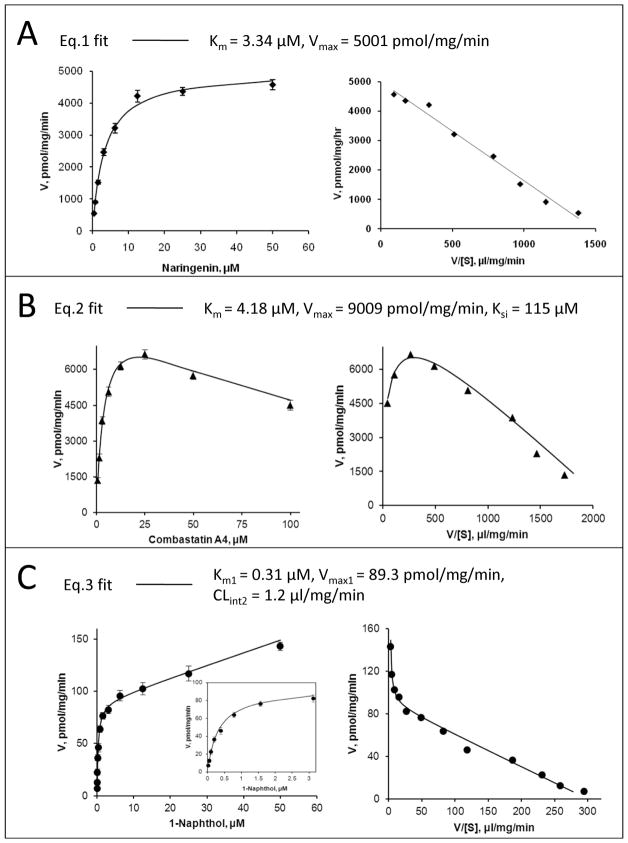
Figure 1. Representative fitting of the model equations (eqs.1-3) to kinetic data of UGT1A9 with its substrates, both rate plot (left) and Eadie-Hofstee plot (right) are given.
Panel A: Eq.1 (Michaelis-Menten model) is used to describe glucuronidation of 27 naringenin by UGT1A9. Panel B: Eq.2 (a substrate inhibition model) is used to describe glucuronidation of 136 combrestatin A4 by UGT1A9. Panel C: Eq.3 (a biphasic model) is used to describe glucuronidation of 21 1-naphthol by UGT1A9. Points are experimentally determined values, while the solid lines show the computer-derived curves of best fit.

