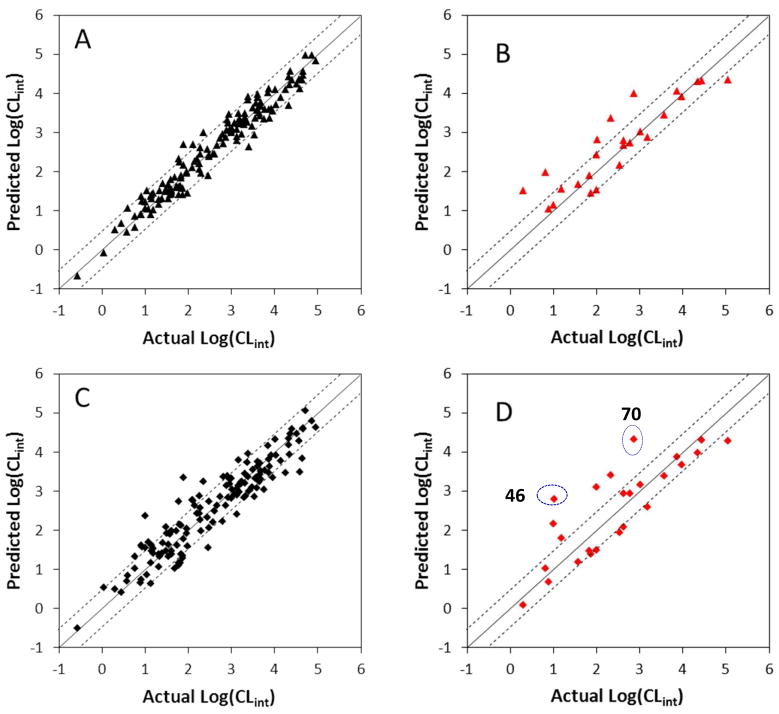
Figure 4. Correlations between the experimental glucuronidation parameters and the predicted ones from the 3D-QSAR models.
Panel A: Fitted predictions versus actual catalytic efficiencies for the training set. The predicted values were obtained using the CoMFA method. Panel B: Predicted versus actual catalytic efficiencies for the test set not included in model derivation. The predicted values were obtained using the CoMFA method. Panel C: Fitted predictions versus actual catalytic efficiencies for the training set. The predicted values were obtained using the CoMSIA method. Panel D: Predicted versus actual catalytic efficiencies for the test set not included in model derivation. The predicted values were obtained using the CoMSIA method. Dashed lines represent the observed prediction bias of 3.0-fold deviation from unity. Solid lines represent the observed prediction bias of 10.0-fold deviation from unity.

