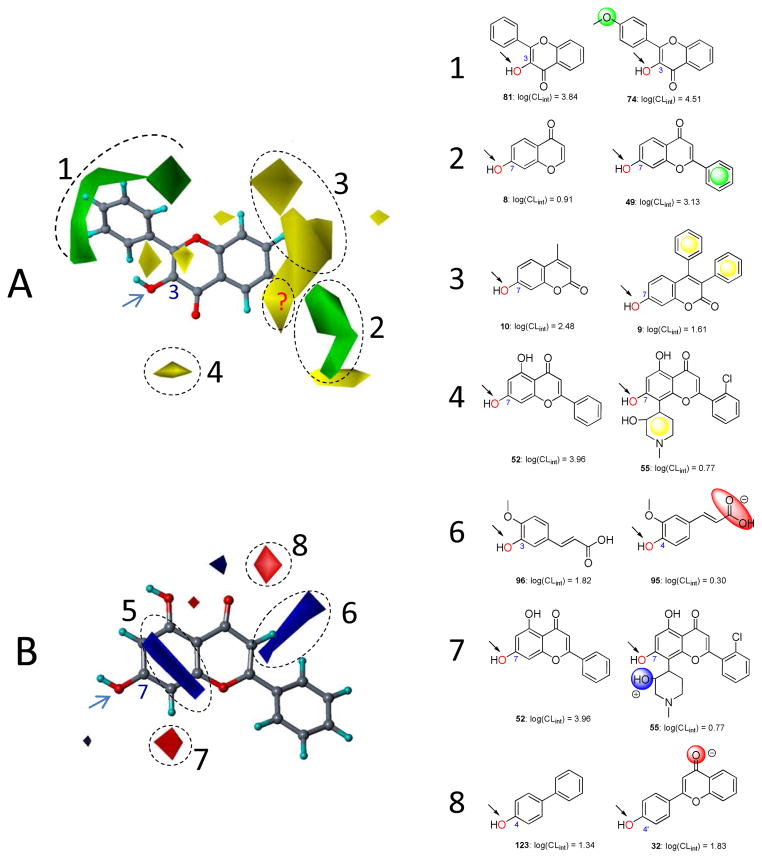
Figure 5. Field contribution maps from the CoMFA analysis.
Panel A presents the steric maps. 3-Hydroxyflavone (81) is shown inside the field for reference. Green: Areas in which bulky groups are sterically favorable for glucuronidation; Yellow: Areas in which bulky groups are unfavorable for glucuronidation. Panel B presents the electrostatic maps. Chrysin (52) is shown inside the field for reference. Blue: Areas in which electropositive atoms/groups are favorable for glucuronidation; Red: Areas in which electronegative atoms/groups are favorable for glucuronidation. Examples are given to on the right side matching the CoMFA results to experimental data. Favored and disfavored contour levels for CoMFA were fixed at 85% and 15%, respectively.

