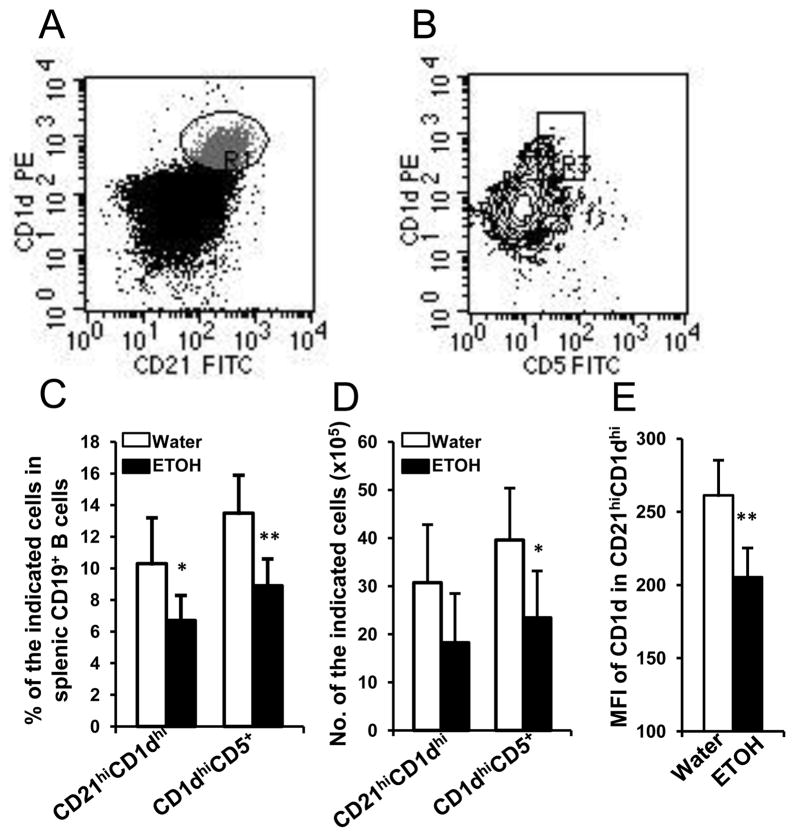
Fig. 6. Effects of chronic alcohol consumption on MZ B cells and CD5+CD1dhi regulatory B cells in the spleen of melanoma-bearing mice at 2 weeks after subcutaneous melanoma inoculation.
A, Dot plot indicating CD21hiCD1dhi MZ B cells (R1) in gated splenic CD19+ B cells. B, Contour plot indicating CD5+CD1dhi regulatory B cells in gated splenic CD19+ B cells. C, Percentage of MZ B cells (CD21hiCD1dhi) and regulatory B cells (CD5+CD1dhi) in splenic CD19+ B cells. D, Number of MZ B cells (CD21hiCD1dhi) and regulatory B cells (CD5+CD1dhi) in the spleen. E, Mean florescence intensity of CD1d in CD21hiCD1dhi MZ B cells. Water: Water-drinking, melanoma-bearing mice. ETOH: Alcohol-consuming, melanoma-bearing mice. Each group contained 7–10 mice. Experiments were repeated once with the similar results. ETOH group different from Water group, * p<0.05; ** p<0.01.

