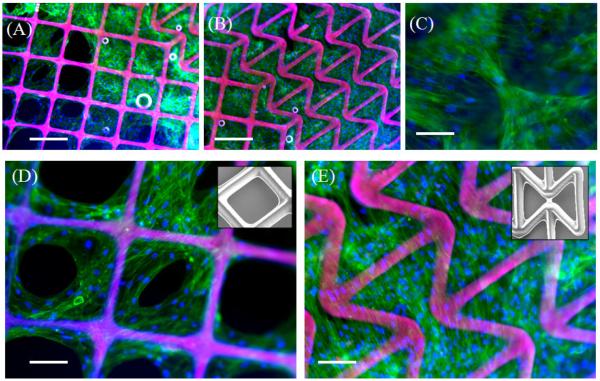
Figure 4.
Fluorescence microscopy images of human mesenchymal stem cells on (A,D) positive Poisson ratio (PPR) region and (B,C,E) negative Poisson ratio (NPR) region. (C) Cells growing in scaffold voids and along scaffold struts in NPR region. (D) Cells growing along scaffold struts (inset: SEM of scaffold struts) in PPR region (E) Cells seeded on NPR region (inset: SEM of scaffold struts). Scale bars represent (A,B) 250 μm and (C,D,E) 125 μm. Green: actin filaments; Blue: Nuclei; Pink: Scaffold struts

