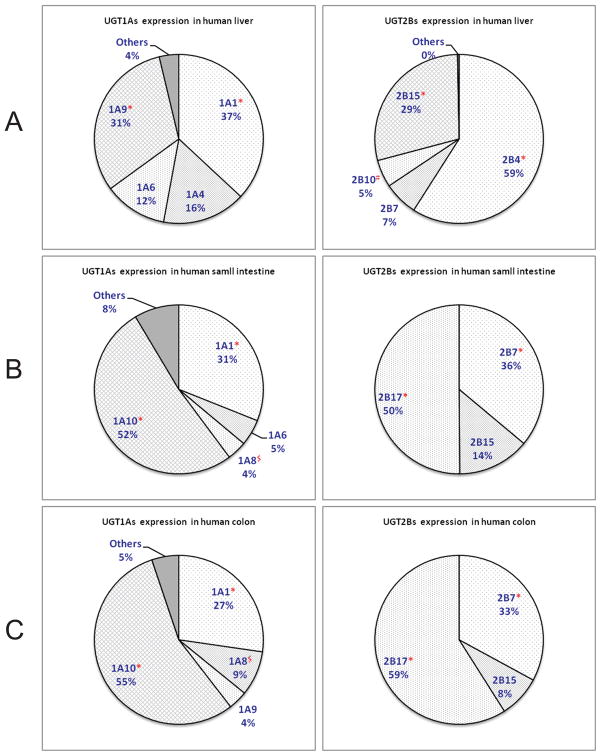
Figure 2.
Relative mRNA distribution level between human UGT1A isoforms (left) and between 2B isoforms (right) in human liver (A), small intestine (B) and colon (C).20 * The two most abundant isoforms in the organs. # The unique isoform in liver. $ The unique isoform in GI tract.

