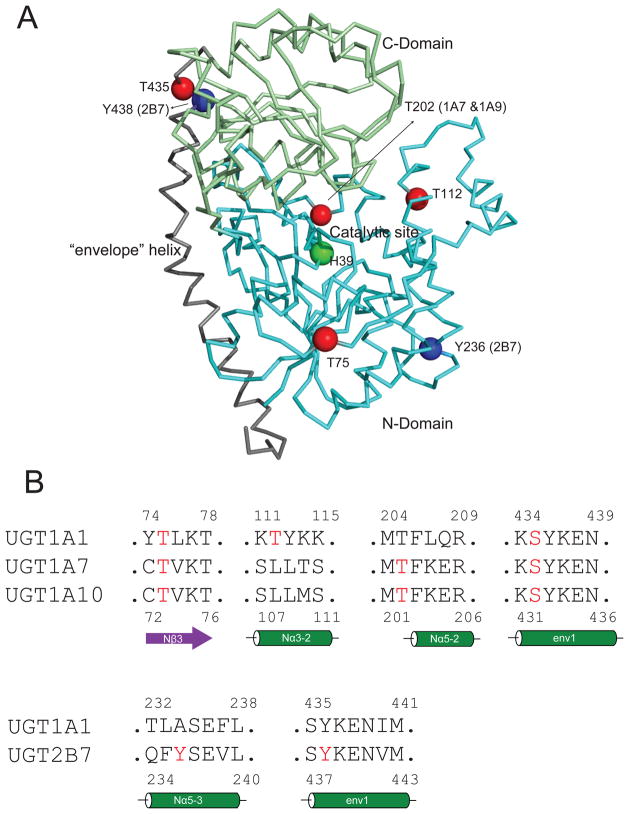
Figure 5.
Panel A locations of phosphorylation sites in UGT 3D structure (UGT1A1 homology model 51). Green sphere: catalytic residue (histidine 39); red spheres: protein kinase C (PKC) mediated phosphorylation sites; blue spheres: Src tyrosine kinase (SrcTK) mediated phosphorylation sites. Panel B: alignment of UGT sequences, showing the phosphorylation amino acids (in red) in secondary structures. Sequence alignment was performed using Clustal W (http://www.clustal.org/)

