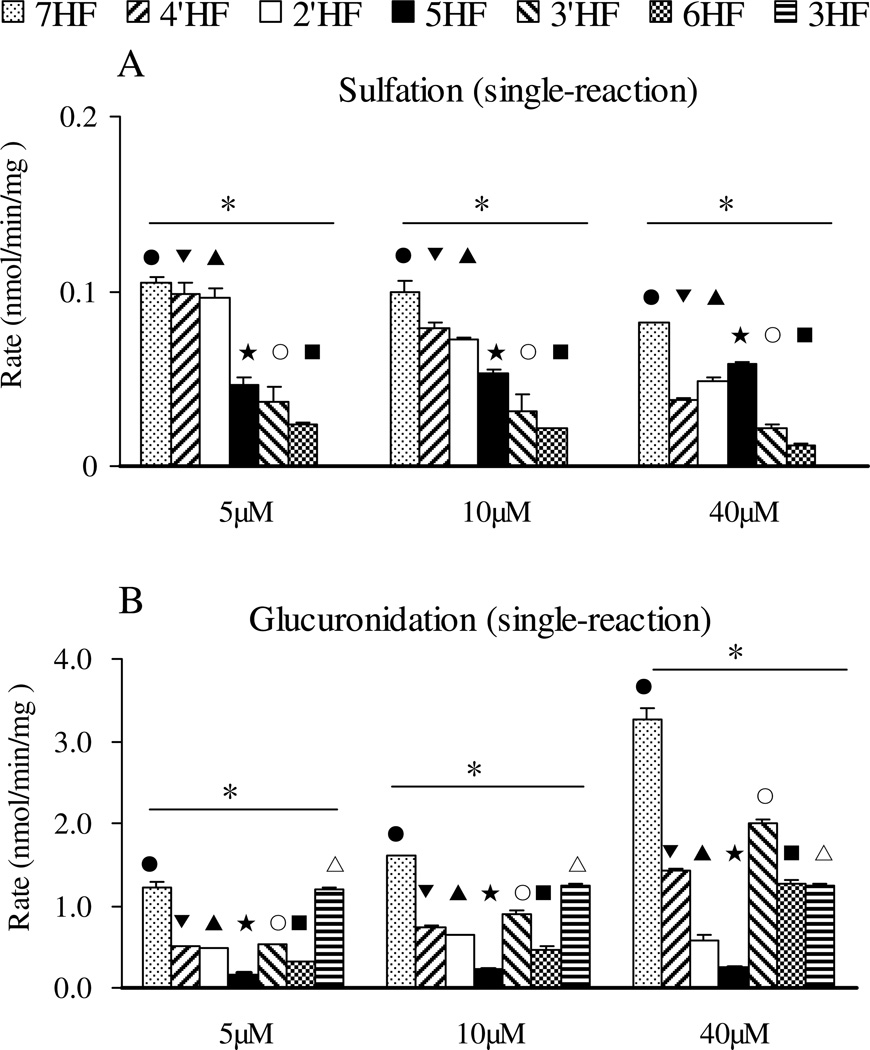
Figure 3. Glucuronidation and sulfation of seven mono-hydroxyflavones in single Sult or Ugt reaction system.
Three different concentrations (5, 10, and 40 µM) were used in the experiments done in triplicates (n=3). The rates of glucuronidation and sulfation were calculated in nmol/min/mg protein. The error bar is the SD of three determinations. The data were analyzed by one-way ANOVA with Tukey post-hoc test. The asterisk (*) indicates a statistically significant difference for the glucuronidation (Figure 3A) and sulfation (Figure 3B) rates among seven mono-hydroxyflavones (p< 0.05, one-way ANOVA). Significant differences between three concentrations for each flavone are marked as follows: ●P<0.05 for 7-HF, ▼P<0.05 for 4’-HF, ▲P<0.05 for 2’-HF, □P<0.05 for 5-HF, ○P<0.05 for 3’-HF, ■P<0.05 for 6-HF, □P<0.05 for 3-HF.

