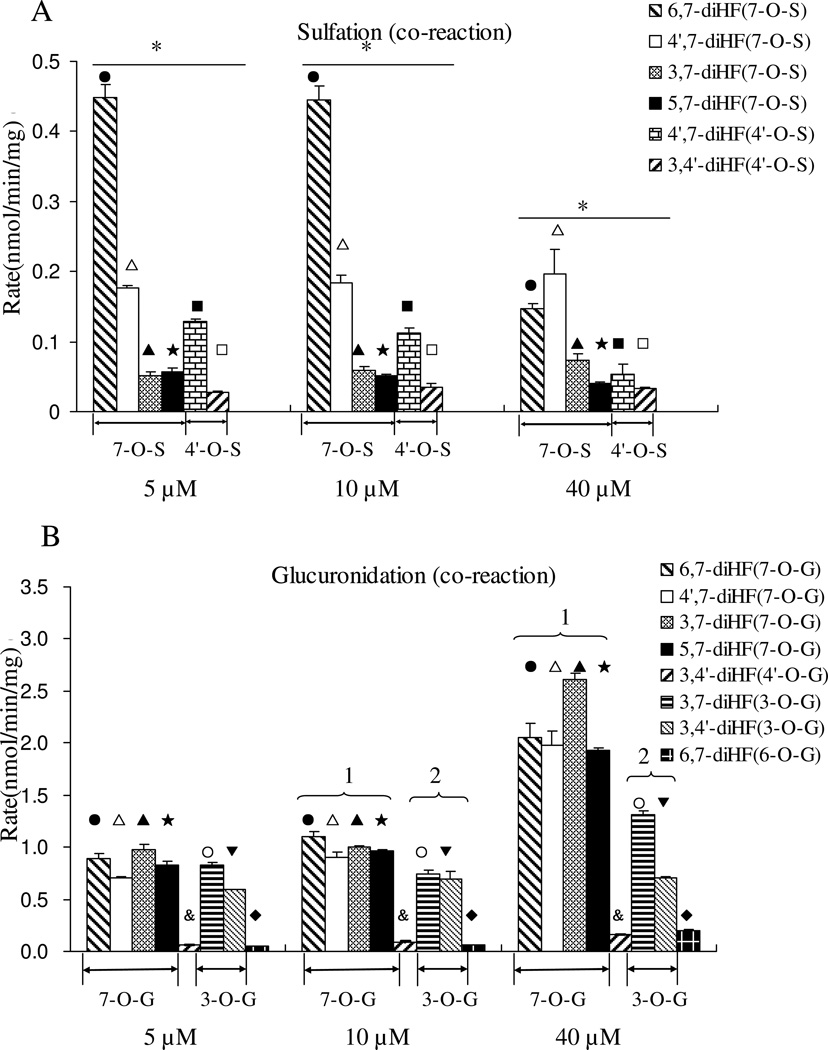
Figure 6. Glucuronidation and sulfation of five dihydroxyflavones by FVB mice liver S9 in a Sult-Ugt co-reaction system.
Concentrations used, number of experiments, and calculation of the rates of glucuronidation and sulfation are the same as in the legend to Figure 3. The data were analyzed by one-way ANOVA with Tukey post-hoc test (Figure 6A) or Univariate ANOVA with Tukey test (Figure 6B). The asterisk (*) in Figure 6A indicates a statistically significant difference for the sulfation rates among five dihydroxyflavones (p < 0.05). Number “1” and the number “2” are the same as in the legend to Figure 4. Significant differences between three concentrations for each flavone are the same as in the legend to Figure 4.

