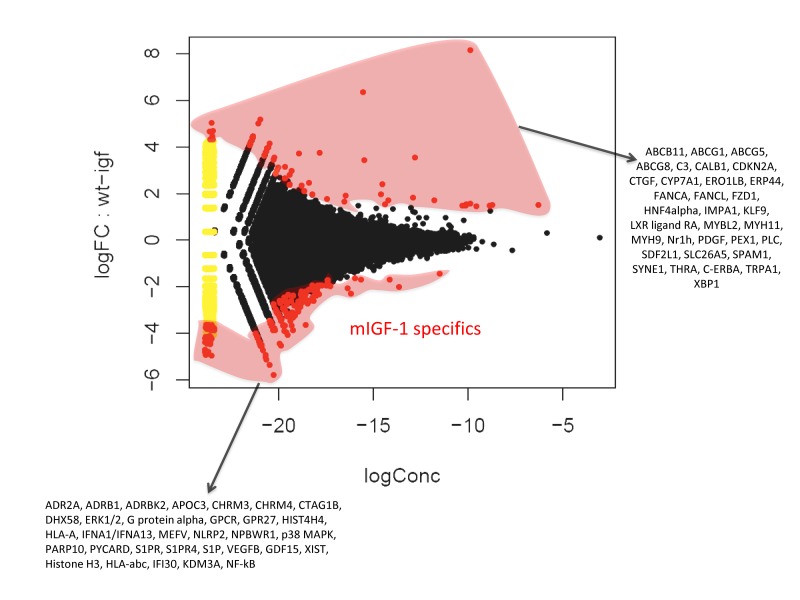
Figure 2. Fold change (FC) plot using common dispersion.
The hearts of 2 WT and 2 cardiac-restricted mIGF-1 Tg mice were excised, chromatin was extracted and immunoprecipitated with an anti-SIRT1 antibody. Purified DNA fragments were processed for sequencing with a Solexa Gene Analyzer II platform (Illumina). Upon bioinformatic analyses, 302 TSS were identified as SIRT1 DNA-bound. Red dots represent TSS differentially bound by SIRT1 in the WT or in the mIGF-1 Tg background, while black dots represent TSS bound similarly by SIRT1 in either genotype.

