Abstract
We present analysis tools which are formulated using wide-field interferometric phase microscopy measurements, and show their ability to uniquely quantify the life cycle of live cancer cells. These parameters are based directly on the optical path delay profile of the sample and do not necessitate decoupling the refractive index and the thickness in the cell interferometric phase profile, and thus can be calculated using a single-frame acquisition. To demonstrate the use of these parameters, we have constructed a wide-field interferometric phase microscopy setup and closely traced the full lifecycle of HeLa cancer cells. These initial results show the potential of the parameters to distinguish between the different phases of the cell lifecycle, as well others biological phenomena.
OCIS codes: (090.2880) Holographic interferometry, (180.3170) Interference microscopy, (170.1530) Cell analysis
1. Introduction
Wide-field interferometric phase microscopy (IPM), also known as digital holographic microscopy (DHM), provides a powerful quantitative tool for label-free biological cell investigation, while offering unique advantages over conventional bright-field microscopy techniques, which lack imaging contrast due to the cell transparency in the optical regime [1].
IPM measures the quantitative phase profile that is proportional to the multiplication of the cell thickness by the difference between the refractive indices of the cell and the surrounding media. The sensitivity of IPM systems to low changes in refractive index enables visualizing cells and inner cell organelles without the use of exogenous contrast agents such as fluorescent dyes.
Various methods have been suggested for decoupling cell thickness and the differential refractive index. In [1–3], it has been shown that a constant value of the refractive index can be assumed for homogeneous cells such as enucleated red blood cells, and thus the quantitative phase profile is proportional to the thickness profile of the sample. For heterogeneous refractive index cells, it is possible to use a coarse approximation on the cell refractive index [4]. Alternatively, one can measure the quantitative phase profile with two different mediums that have different refractive indices. Then, by subtracting the two phase measurements, cell thickness profile can be calculated [5]. Recording the sample from multiple points of view and using Radon transform is another technique for decoupling refractive index and thickness in the phase profile of the sample [6,7]. The first type of methods cannot be used for most biological cells since the heterogeneity of the cell refractive index will lead to significant errors in the measurement, while the latter methods have a risk of losing cell dynamics since more than a single frame of acquisition is needed. Other studies have shown that it is possible to calculate the cell refractive index profile by restricting the cells to a known thickness [8,9]. This method, however, might influence the cell normal behavior.
In the case of heterogeneous refractive-index cells, studies have shown that certain biologically-relevant parameters can still be found directly from the phase profile of the cell. These include dry mass, cell projected area, and relative cell volume (under isotropic volume change assumption) [1–3,5,10–12]. Differential time analysis on the uncoupled phase profile has also been shown to be useful for defining new cell parameters using which it is possible to characterize heterogeneous refractive-index and highly-dynamic cells [13].
The current paper suggests analysis tools that extend the ability of IPM systems to measure biologically relevant parameters to the general case of cells with heterogeneous refractive-index structure, without the need to decouple cell thickness and refractive index as a prior stage, and without the need to acquire more than one frame in order to obtain meaningful values of cell parameters. To obtain this goal, we present known parameters and newly formulated parameters that are based directly on the quantitative phase profile of the cell and are able to uniquely quantify various cell behaviors.
Using these phase-based parameters, we investigated the life cycle of ten HeLa (human cervical cancer) cells, and showed initial abilities of the parameters to distinguish between the different stages of the cell lifecycle, predict upcoming lifecycle phases, and measure biologically useful properties. The results agree with earlier insights about the behavior of HeLa cells.
In general, the formulated parameters provides label-free non-contact tools that can be used to obtain insights about cells behavior and help with unsolved problems in cell biology such as individual cell growth regulation [14].
2. Analysis tools and presentation of phase-based parameters
To obtain the quantitative phase profile of the sample, various IPM setups were previously suggested [1–3,15–17]. These include wide-field digital interferometry configuration that is based on an off-axis holographic setup [1], and enables us to obtain the quantitative phase profile of the sample by using only a single interferogram. After its acquisitions, the digital processing on the acquired interferogram includes separating the +1 order image from the zero order image by digital spatial filtering. Then, an unwrapping algorithm is applied on the phase of the result to remove 2π ambiguities [18]. After this process, the phase profile is defined as follows [1–4]:
| (1) |
where λ is the illumination wavelength, hm is the thickness of the cell growth medium, nm is the refractive index of the medium, hc is the thickness profile of the cell, and is the cell integral refractive index which is defined as follows [2]:
| (2) |
Next, we summarize relevant parameters that can be calculated directly from the quantitative phase defined in Eq. (1). We divide these parameters into groups according to their mathematical relations, where part of the parameters is simply proportional to the other ones. Yet, we define them all since these parameters are used in different forms in the literature when based on the cell thickness profile. Again, note that we generalize these definitions by using the quantitative phase profile directly, without decoupling the thickness profile as a prior stage.
- a. OPD profile of the cell: The cell optical path delay profile (OPDc) is defined as the first element inside the brackets of Eq. (1), as follows:
(3) OPDc provides visualized information on the cell structure and, in fact, is a volumetric map of the cell thickness coupled with its refractive index structure. Trivial parameters that can be calculated from OPDc include its maximum, minimum, mean, median, and dynamic range. Those five parameters can be used for mapping purposes by a comparison with the cell areal or mass-based center. By comparing OPDc profiles at different time points, changes in the cell structure and substructures can be seen [13].
In the specific case where the refractive index of the cell is known (such as for red blood cells [2,3]), OPDc is simply proportional to the thickness profile of the cell.
where α is the refractive increment and approximated as 0.18-0.21ml/g, Sc is the projected cell area on the x-y plane, and is the averaged OPD over the cell area. Thus, for calculating the cell dry mass from the phase profile, decoupling thickness and refractive index is not required. Dry mass is an important cell parameter since it gives noninvasive information about cell growth [6,19]. In long-time measurements, the cell mass-change rate or the growth rate can be calculated as well.
- From the definition of dry mass, we can calculate two additional parameters: dry mass surface density and dry mass averaged density as follows:
(5) (6) Dry mass surface density describes the inner cell organelles and components in different locations in the cell and can be used to measure local intracellular changes. Note that since αis constant, the dry mass surface density is proportional to .
- Let us define the phase volume as follows:
(7) The cell phase volume is not the actual cell volume but only the equivalent of the cell volume that is based on directly, and does not require decoupling of the cell thickness first. In the specific case in which the refractive index of the cell can be considered as constant, will be proportional to the actual cell volume, defined as the integral over the entire area of the cell thickness profile. In any case, as can be seen by comparing Eqs. (4) and (7), the phase volume is proportional to the dry mass of the cell, and therefore we included dry mass and phase volume under the same section.
- c. Phase surface area: The cell phase surface area can be calculated as the sum of the upper surface area of the phase profile and the projected area as follows:
(8) where dA is the discrete cell surface area as projected over a single camera pixel and δhx and δhy are the gradients along the x and y directions of the cell OPD profile [21,22]. Again, in the specific case where the refractive index is known, a similar version of Eq. (8) can be used on the uncoupled thickness profile of the cell to calculate the actual surface area of the cell.
- d. Phase surface area to volume ratio and phase surface area to dry mass ratio: Phase surface area to phase volume ratio is defined as follows:
(9) These two parameters can quantify cell metabolism and describe how much material a surface unit transfers to one volume unit or mass unit.
- e. Projected area to volume ratio: Volume to area ratio is a parameter which describes the flatness of the cell. This ratio is calculated as follows:
(11) - f. Phase sphericity index: Sphericity quantifies the degree of cell roundness. The sphericity of an object is the ratio of the surface area of a sphere that has the same volume of the object of interest and the surface area of this object. When based directly on the phase profile, this parameter is calculated as follows:
(12) For some cells, round shape is a value that can imply on cell abnormality and for other cells the situation is reversed. For adherent cells, this parameter can be used to determine the level of attachment of an individual cell to the substrate, since as the level of attachment increases the cell flatness. Thickness-based sphericity was used by Canham and Burton to diagnose red blood cells [25].
g. Phase statistical parameters: Various statistical parameters related to the phase measurement can be used to describe cells. These parameters include phase kurtosis, skewness and variance, and describe the dry mass or volume distribution in the cell. These parameters are based on changes in phase values and thus react to structural alternations or creation of cell organelles and factors. To use these parameters, the phase values over the projected cell area need to be written as a single vector containing n values. Afterwards, the following statistical parameters can be defined:
- Phase variance—Measures how a set of the cell OPD values is spread out.
(13) whereis the cell phase values and is the mean of these values.
- Phase kurtosis—Measures whether the cell OPD distribution is more peaked or flatter.
(14) - Phase skewness—Measures the lack of symmetry of the cell OPD values from the mean value.
(15) Note that phase kurtosis and skewness describe the shape of the cell OPD histogram.
- h. Cell eccentricity: Eccentricity is a parameter that can be thought of as a measure of how much the conic section deviates from being circular. Mathematically, it is defined as follows:
(16) where rmax and rmin are the maximum and minimum radii of the cell, respectively, as can be calculated from the cell projected area. Eccentricity can be used to determine cell vitality because, for some cells, round shape implies on cell apoptosis and, in other cases, a non-round shape of the cell is an indication of disease.
3. Lifecycle characterization of HeLa cells using the phase-based parameters
Previous works used IPM to characterize growth of cells with a short lifecycle, such as yeast cells [19] and other eukaryotic cells, using their dry mass and morphological changes [4,20].
Cancer cells have a complex refractive-index structure due to the presence of a nucleus and other organelles of various refractive indices, and thus extracting the physical thickness from the quantitative phase measurement using a single interferogram is not possible. As in other eukaryotic cells, cancer cell life cycle is a series of orderly events occurring during the life of the cell, which ends in cell duplication and division to new daughter cells.
The cell lifecycle is composed of two main periods called interphase and mitosis [24]. Interphase is a highly metabolic state in which the cell performs most of its growth. This period consists of three stages or phases called G1, S and G2 (occurring in this sequence). During the G1 phase, the cell is metabolically active and most of the cell organelles and cytosolic components are duplicated. The S phase is the interval between the G1 and the G2 phases, during which DNA and centrosome replications occur. Metabolically, the cell is inactive during this stage. The G2 phase is a continuation of the cell growth during which enzymes and proteins are synthesized, preparing the cell for the upcoming division. Mitosis is the final period of the lifecycle during which the cell divides. This stage consists of four sub stages called prophase, metaphase, anaphase and telophase.
We next demonstrate the usefulness of the generalized phase-based parameters defined above to describe cellular behaviors at the different phases during a full lifecycle of HeLa cells. After presenting the biological protocols and the optical system used, we will present detailed results of one cell and then introduce validations and statistical results using nine additional cells.
4. Methods
4.1 Culture preparation
HeLa cells have a lifecycle duration that can last for up to 30 hours, which requires long and continued periods of imaging. Due to this situation, the cell growth medium was chosen to enable long life of HeLa cells without requiring medium change. We used a high glucose-based medium containing 90% high glucose Dulbecco's modified eagle medium (DMEM), 10% fetal calf serum (FCS), 2mM L-glutamine and 100u/ml penicillin. During the experiment, cell temperature of 37°C was constantly maintained using a custom-built temperature controller with feedback circuit that was connected to the cell stage. Maintaining the temperature was important because HeLa cells progress in their lifecycle and divide only in temperatures ranging between 33°C and 40°C [26].
Since medium acidity can lead to cell apoptosis, we reduced it by lowering the cell confluence to million cells per 15ml medium and used growth medium from a culture with high confluence combined with fresh medium. Under these conditions, the cells continued to divide for more than 72 hour after the beginning of the experiment.
4.2 Experimental setup
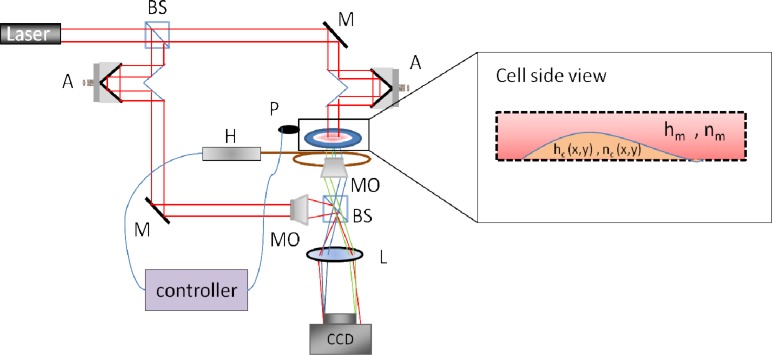
In order to acquire the OPD profiles of the cells and demonstrate the usefulness of most of the parameters defined above, we used IPM to image HeLa cells. Since these cells have a lifecycle that can last up to 30 hours, we constructed an IPM setup with an integrated temperature control that is capable of imaging the quantitative phase profiles of the cells for more than 48 hours. The constructed IPM setup used is shown in Fig. 1 . This setup is based on a modified Mach-Zehnder interferometer and it includes a 632.8nm, 0.5 mW Helium-Neon laser, two retro-reflectors inserted in the beam paths, two 40 × , 0.65 numerical-aperture microscope objectives, and a monochromatic CMOS camera with 5.2µm square pixels (Thorlabs DCC1545M).
Fig. 1.
Wide-field IPM system with heat control. BS – beam splitter, MO – microscope objective, A – retro-reflector for beam-path adjustments, M – mirror, L – lens, P – temperature probe, H – heat source.
The camera settings were set on no gain, exposure time of 15 msec, gamma value of 1.6 and a clock rate of 5MHz to increase stability. A macro-code written by us was used in combination with the camera software to automatically record the images in the frame rate determined by the user.
We reduced focus drift by manually correcting it every 4-6 hours during the day and every 10 hours during the night. Furthermore, controlled temperature in the lab and near the sample helped to reduce thermally induced drifts.
Using this setup, we obtained an OPD spatial stability of 1.1nm, temporal stability of 0.62nm, maximum focus drift of 20 nm and mean drift of 10.1 nm.
The lateral resolution of the setup was calculated as 600 nm, which is suitable for imaging most, but not all of the cell organelles of interest. HeLa cell diameter is 15-30 µm, with a nucleus size of approximately 10 µm and the typical mitochondria length of 1-2 µm and 0.2-0.7 µm in diameter.
4.3 Data acquisition and processing
We continually acquired off-axis interferograms of the sample for 50 hours at a rate of 2 frames per minute, and processed them to the quantitative OPD profile of the sample using digital spatial filtering and phase unwrapping algorithm, as explained in the beginning of Section 2. To calculate the cell OPD, we selected, at each frame, the area of interest containing only the analyzed cell. The background was defined as every point in the OPD profile that was lower than 2.2 nm (which is double than the spatial stability) and not related to the main area of the cell.
We have performed several 50-hour experiments in order to find cells that were a part of a cluster but were separated enough, since this situation demonstrates the usefulness of the generalized parameters for describing the lifecycle of the HeLa cell in the optimal way. Fig. 2(a) is linked to a video presenting the dynamic quantitative OPD profile of HeLa cells starting at the beginning of the lifecycle, right after the mother cell divides
Fig. 2.
(a) Full lifecycle of HeLa cells, visualized by the OPD profile (Media 1 (3.9MB, MPG) , 3.92 MB); (b) OPD stability measurement during the 20-hour experiment in the box marked in Fig. 2(a). The standard deviation of the OPD fluctuations was only 2.16 nm, indicating on the validity of the recorded biological phenomena.
In order to validate that the measured changes are caused by the cells themselves and not due to the setup temporal instability, we selected an area of 50 × 50 pixels near the tested cells (indicated by a square in the top-left corner of Fig. 2(a)) and calculated the OPD fluctuations during the 20-hour experiment. The standard deviation of the graph shown in Fig. 2(b) was only 2.16nm.
From this result, we determine that the fluctuations during the experiment, despite of the wet environment (imaging through cell media), are almost not affected by the temporal fluctuations of the system, but rather by the biological phenomena. In addition, the temporal OPD stability obtained from 20 interferograms per second during 30 second measurement without the presence of the sample, indicating on the pure stability of the system in dry environment, is 0.62nm.
As can be seen in Media 1 (3.9MB, MPG) , the upper cell went through apoptosis and the other cell completed a full lifecycle. In a small number of frames, the two cells partially overlap. To correct this distortion, we manually subtracted the mean values of the overlapping part of the upper cell from the lower cell during the parameter calculations.
5. Results
5.1 Detailed analysis on one cell
In the following, we demonstrate the usefulness of the parameters defined in Section 2 to describe cell behaviors at the different phases during a full lifecycle of a cancer cell. For clarity, we first relate only to the lower cell presented in Media 1 (3.9MB, MPG) .
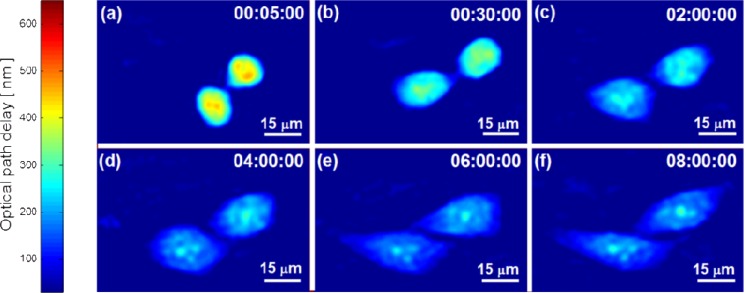
Figure 3 shows the OPD profiles of the cell at different points during the measurements of the G1 phase, occurring in the first eight hours of the experiment and illustrating the cell shape and growth. We conclude that the cell in the beginning of the experiment is at G1 phase by knowing that we started the experiment right after cell division (the way we determine the rest of the cell lifecycle phases will be explained later).
Fig. 3.
OPD profiles of HeLa cells during G1 phase.
As expected theoretically and seen in other works [20], during the G1 phase, the cell grow and increase its surface area and dry mass. This increase lasts until the beginning of the S phase, when the cell dedicates all of its energy to DNA replication. In Figs. 3(c-f), cell growth is seen as a visual increase in the projected area. Some of the areal increase is due to the attachment of the cell to the substrate after division and it occurs during the first two hours as seen in Figs. 3(a,b) and Media 1 (3.9MB, MPG) , which is validated as explained next.
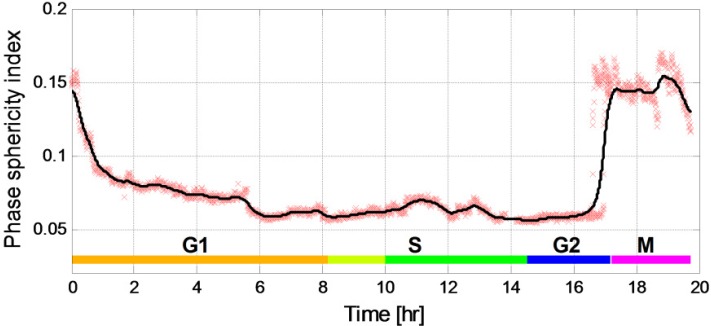
Figure 4 presents the phase sphericity index (Eq. (12)) measured throughout the experiment. The red points in all of the figures are the measured values of the parameter and the black line is a fit graph obtained by averaging the nine closest points.
Fig. 4.
Phase sphericity index values during the cell lifecycle (R2 = 0.971).
We determine the quality of the fit by measuring the R2 regression correlation coefficients between the fit and the measured data (indicating on the strength of association between the experimental measurement and the fitted variable). The test results showed a good agreement, with R2 value higher than 0.895 for most of the results (the exact values are listed in the captions of each of the figures).
The attachment of the cell to the substrate can be validated using Fig. 4. Since HeLa cells are adherent, right after mitosis the cells are round and are not attached to the substrate, causing a high value of the phase sphericity index. Over time, the cell starts attaching to the substrate and flatters out, leading to decrease in the phase sphericity index. In the first two hours, we calculated a 51.28 ± 2.34% (mean ± standard deviation) decrease in cell sphericity, while 49.35 ± 2.4% decrease was measured during the first hour (phase sphericity index of 0.156 ± 0.004 at the beginning of the experiment, 0.079 ± 0.003 after one hour, and 0.076 ± 0.002 after two hours). Following this, we measured a change of up to 3% per hour until hour 17 (which will be later recognized as the transition of the cell to the mitosis phase). Those results meet our expectations that during most of the HeLa cells lifecycle, until the mitosis phase, the cells are flatten (this will also be confirmed later in Figs. 7 and 9, presenting the cell at phases S, G2 and M). Furthermore, the changes in the sphericity index in the first two hours are not likely to be related to the changes in the refractive index due the small change in the dry mass during G1 phase (as explained in the next paragraph).
Fig. 7.
OPD profiles of HeLa cells during S phase.
Fig. 9.
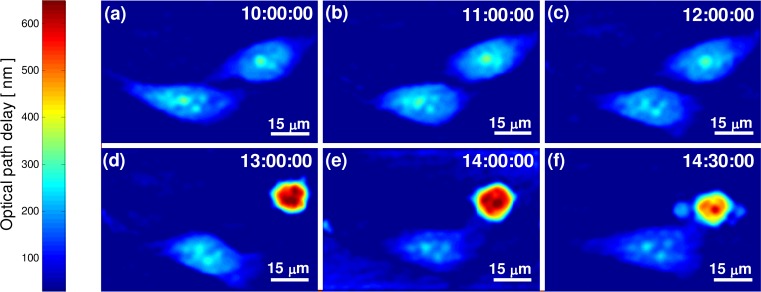
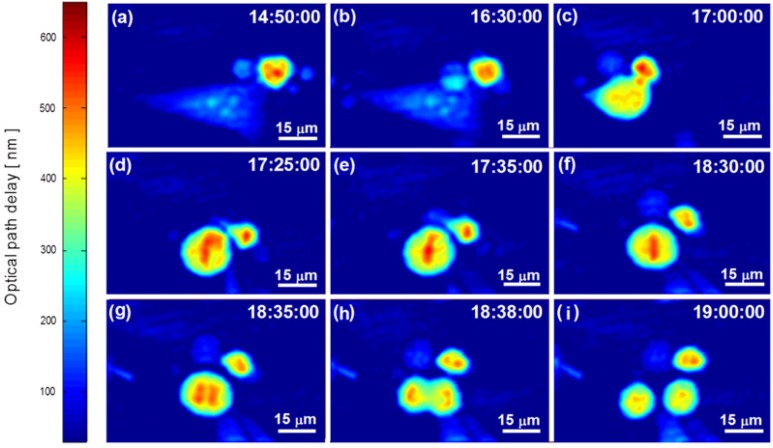
OPD profiles of HeLa cells during G2 phase (a-c) and M phase (d-i). (d) Prophase stage; (e) The beginning of metaphase stage; (f) The end of metaphase stage; (g) The beginning of anaphase stage; (h) The beginning of telophase stage; (i) Cytokinesis stage.
Figure 5 presents the dry mass parameters defined in Section 2b. The cell lifecycle phase durations are marked on the figure. The discrimination between the lifecycle phases is done using the calculation of the statistical parameters, as shown later, and the dry-mass behavior [27]. As said previously, the G1 and G2 phases of a eukaryotic cell are characterized by an increase in dry mass, whereas in the S phase the cell does not grow so the dry mass does not change. M phase is characterized by cell division.
Fig. 5.
Dry-mass parameters during a life cycle of HeLa cells: (a) Dry mass (R2 = 0.9486); (b) Dry mass average density (R2 = 0.975).
In Fig. 5(a), by looking at the changes in the line general direction and its slope value, one can see that there is a first dry-mass increase lasting until hour 10:05, and a second dry-mass increase which begins at hour 14:35 and lasts until hour 17:00, when the cell collapses to a round shape. The second higher increase coincides with the G2 phase and the first increasecoincides with the G1 phase [20]. Although the minimal expected period for S phase is 6 hours, by comparing the dry mass mean value during S phase to values during G1 phase, we notice that the mean value is equal to the value at the beginning of the 8th hour. We thus hypothesis that the dry mass increase, which is seen in Fig. 5(a), lasting from the beginning of the 8th hour to the beginning of the 10th hour, is not a part of the G1 phase, although it is theoretically expected.
To confirm our distinction between the G1 and S phases, we did a linear regression tests for the G1 area and for the combined area. The tests show that the combined area has a lower regression value compared to the G1 area (0.961 compared to 0.79), meaning that we have two different periods. These results were also reinforced by the phase statistical parameters, as explained later.
In Fig. 5(a), the duration of the dry mass increase, defined as the G1 phase (orange area), is 8 hours, where the cell dry mass in the beginning of the 8th hour is 400 picogram. The duration of the G1 phase and the final values of dry mass in this phase are in agreement with previous measurements made on HeLa cells [27,28].
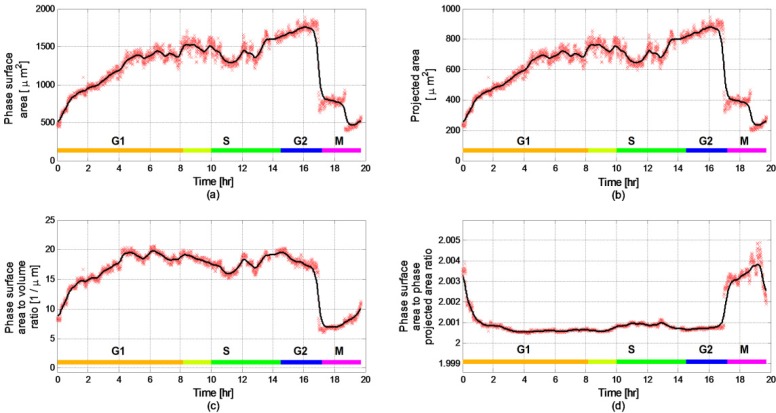
Figure 6 presents the areal parameters of the cell. As illustrated in Figs. 6(a,b), during the G1 phase large increase in cell surface area and the projected area are seen. By increasing cell area, the cell facilitates material diffusion and gains more viability. Figure 6(c) presents the phase surface area to volume ratio, which is a measure for the cell metabolism. During the G1 phase, while the cell mass increases until the 8th hour, the phase surface area to volume ratio comes to a steady state after only 4.5 hours. This can be explained by a known metabolic behavior: the cell contact with the outer medium increases to improve the diffusion of materials and waste. However, since diffusion is efficient only over short distances and large cell would not be able to move materials, its phase surface to volume ratio is limited [24]. This steady-state value sustains until the mitosis phase occurring at approximately 17 hours after the beginning of the experiment. Similar behavior is seen in Fig. 5(b). Note that the phase surface area changes in Fig. 6(c) can also be explained by the attachment of the cell to the substrate. However, we believe that due to the small change in the phase sphericity index after the first hour (see Fig. 4), the phase surface area changes after the second hour are not due to cell attachment.
Fig. 6.
Areal parameters during a lifecycle of HeLa cells: (a) Phase surface area (R2 = 0.9638); (b) Projected area (R2 = 0.9638); (c) Phase surface area to volume ratio (R2 = 0.9781); (d) The ratio between the phase surface area and the projected area (R2 = 0.9724).
From Figs. 3(e,f) and Fig. 6(b), we can see that from the 6th hour the cell is spread and sustains a constant projected area and average dry-mass density. Figure 6(a) shows that the cell phase surface area is 1400-1700 µm2 while the cell is spread. Due to minor changes in the refractive index, our phase-based calculated value still agree with previous work done on spread HeLa cells [29], which showed that the mean surface area of spread HeLa cells is 1600 µm2. Furthermore, as can be seen in Fig. 6(d), by comparing the measured values of the projected area and the phase surface area, we can see that the phase surface area of the cell is approximately double the projected area, meaning that during the entire lifecycle of the tested cell and even when the cell is considered to be round, the cell is flattened.
Following the G1 phase, the S phase is seen in Fig. 5(a) as the interval between the G1 and the G2 phases (marked in green), where the cell dry mass does not change [24].
Figure 7 presents the OPD profile during S phase as distinguished using Figs. 5(a), 8(a) and 8(b). As indicated in Figs. 7(a-f), despite that during S phase the cell is metabolically inactive, the cell continues to change its size and shape. This shape and size changes have minor influence on the projected area and on the phase surface area to volume ratio as can be seen in Figs. 7(a,b).
Fig. 8.
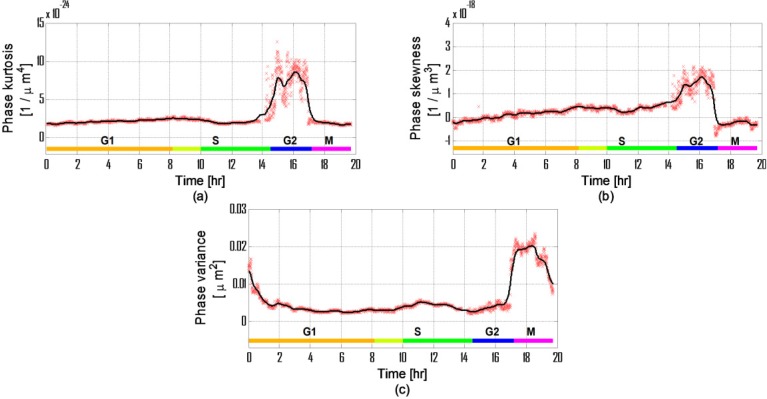
Statistical phase-based parameters during a life cycle of HeLa cells: (a) Phase kurtosis (R2 = 0.901); (b) Phase skewness (R2 = 0.9151); (c) Phase variance (R2 = 0.9752).
Figure 8 presents the OPD-based statistical parameters. Previous work showed that changes occurring in the nucleus during the different life-cycle phases influence its refractive indices [30]. These changes will be seen in the statistical parameters since the values in the cell OPD vector change. An increase in the nucleus OPD values, which is already expected to be the highest value in the cell OPD profile, will influence on the mean and the distribution of the OPD values. Because of this, the phase variance increases. This increase will be mostly seen during the S phase since the changes occurring in this phase are nucleus related.
Phase skewness and phase kurtosis are influenced by formation of cell organelles, which change the values and shape of the cell OPD histogram. These changes occur mostly during the G1 and G2 phases.
As said previously, the S phase starts at the beginning of the 8th hour. The S phase is clearly distinguished from the G1 and the G2 phases in Figs. 8(a) and (b) by looking at the change occurring at the 8th hour and lasting until the beginning of the G2 phase (green area). The duration of this change matches with the typical duration of S phase in HeLa cells (6.5 hours, see [28]).
The area listed as G1 phase was also confirmed by using linear regression, with values of 0.9549 for the skewness and 0.9484 for the kurtosis. For the combined area of the G1 and the S phases, the regression values were only 0.819 and 0.1397, respectively, meaning that the phase skewness and kurtosis graphs indeed describe two different behaviors during these two periods, and that indeed we can uniquely discriminate between the G1 and the S phases of the cell lifecycle using these OPD-based parameters.
By comparing the results seen in Figs. 5(a) and 8(b), we can see that phase skewness provides better discrimination of the cell phases than the dry mass and is less sensitive to measurement errors since the statistical measurements are relative and less influenced by instantaneous values. Still, because the statistical parameters may vary due to the number of pixels measured, we needed to confirm that the changes measured here are not caused by the change in the cell-projected area alone.
To negate this option, we calculated the correlation coefficient between the statistical parameters and the projected area. The results show moderate correlation values of −0.619 for phase variance, 0.6099 for phase skewness and 0.56 for phase kurtosis. Because we expect some statistical correlation caused by cell growth, between all of the measured values, we had to set boundaries for the correlation coefficients between two values that have theoretical high and low correlations with the cell projected area. We did this by calculating the correlation coefficients between the projected area and the dry mass, which was equal to 0.443, and between the projected area and the phase surface area, which was equal to 0.999. From these values, we assume that most of the changes in the statistical parameters are not due to changes in the cell projected area but due to cell growth.
Figure 9 presents the OPD profile of the cell during the G2 and the M phases. There is no significant change visible in Figs. 9(a-b) during this phase, despite that the cell is highly active as can be seen from its dry mass (Figs. 5(a)). Figure 9(c) presents the end of the G2 phase as the cell collapses to a round shape as preparation to cell mitosis.
As explained before, the G2 phase can be distinguished in Fig. 5(a) as a fast increase in dry mass occurring between hour 14:35 and hour 17. The mass increase rate during this phase is 465% higher than the rate of G1 phase (56.5 picogram per hour and 12.2 picogram per hour, respectively). During this phase, the mass increases by 46%.
Figures 9(d-i) presents the different stages of the M phase and enables us to see the progression of cell division. In Fig. 9(d), we see the prophase stage of the cell. During this stage, the inner cell structures split [24,31] and therefore the dry mass decreases as can be seen in Fig. 5(a) at hour 17:25 until hour 18:43. This corresponds with a previous work on eukaryotic cells showing a volume decrease during metaphase [32]. Note that the dry mass steep decrease seen after hour 18:43 is due to cell splitting. We continued to measure only the left cell after the mother cell has divided, and therefore we have approximately half of the dry mass of the mother cell after hour 18:43.
The phase variance measurement shown in Fig. 8(c) reacts during the prophase stage and can be seen as a local peak at hour 17:25. Followed the prophase stage, the metaphase is seen in Figs. 9(e) and (f). In Fig. 8(c), this stage can be seen as a local low point at hour 17:40. Corresponding with the anaphase and the telophase shown in Figs. 9(g) and (h), respectively, the phase variance has two distinguished values, as seen in Fig. 8(c) at hour 18:40 and hour 19:00. The changes in the phase variance are due to the changes in the cell structure leading to changes in the distribution of OPD values in the cell area, and can be seen in Fig. 9 and Media 1 (3.9MB, MPG) .
The end of the life cycle shown in Fig. 9(i) as the mother cell completes cytokinesis. As a results, two daughter cells equal in size are created, each of which has half of the dry mass of the mother cell (see Fig. 5(a)). The cell OPD profile in Fig. 9(i) is similar to the cell OPD profile in the beginning of the cycle as shown in Fig. 3(a).
5.2 Validation using 10 cells
In order to verify the results, we repeated the calculations of the previously discussed parameters and the entire detailed analysis for nine more cells as described before. For the sake of shortness, we present additional parameter behavior for three more cells, and additional results for selected parameters for all ten cells.
Figure 10 presents the two most-relevant parameters, in this case for the upper cell, shown in Media 1 (3.9MB, MPG) (until it went through apoptosis): the dry mass and the phase skewness. While the graphs are different from these of the first cell, they present similar behaviors. Particularly, the two cells present similar duration of G1 phase, as calculated using the above-described analysis, and as expected from two cells divided from the same mother cell. For this cell, the dry mass during the S phase, presented in Fig. 10(a), is slightly lower than this of the previously-analyzed cell, with a value of 351 picograms. However, the growth rate during the G1 phase is similar to the previous cell with value of 9.7 picograms per hour. The phase skewness values of the upper cell, presented in Fig. 10(b), show similar behavior compared to the phase skewness of the previously analyzed cell (see Fig. 8(b)).
Fig. 10.
Two of the parameters measured for the upper cell in Figs. 3, 7 and Media 1 (3.9MB, MPG) during its partial life cycle (until apoptosis occurs): (a) Dry mass (R2 = 0.8928); (b) Phase skewness (R2 = 0.9223).
Both phase skewness measurements increase during the G1 phase and come to a similar steady-state value of 0.36m−3 for the lower (previously-analyzed) cell and 0.338 m−3 for the upper cell. The other parameters not presented here were also calculated and showed similar results to their equivalents in the lower cell.
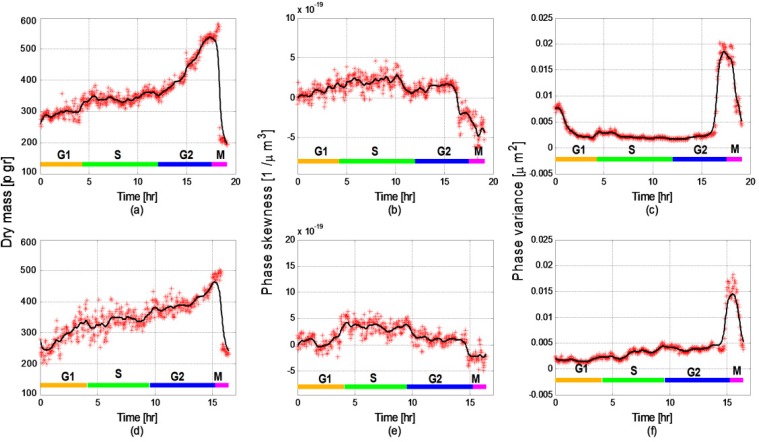
Figure 11 presents the measured values for two additional HeLa cells. The dry mass values seen in Figs. 11(a,d) for both of the cells show similar behavior and values to each other and to the previously-described cells during all of the cell phases, although different cells have different lifecycle periods. The lifecycle phase classification was established based on the dry mass values combined with the statistical parameters as described before.
Fig. 11.
Three chosen parameters measured for two additional cells: (a,d) Dry mass (R2 = 0.9344 for the upper graph and R2 = 0.8961 for the lower graph); (b,e) Phase skewness (R2 = 0.87 for the upper graph and R2 = 0.8471 for the lower graph); (c) Phase variance (R2 = 0.9801 for the upper graph and R2 = 0.954 for the lower graph).
The values of phase skewness presented in Figs. 11(b,e), besides the values during the G2 phase, show similar behavior to the measurement presented in Fig. 8(b). We assume that the differences during the G2 phase are due to the influence of the apoptosis of the cell. Nevertheless, the result shows that the G1 and S phases can be distinguished by the phase skewness. The phase variance presented in Figs. 11(c,f) is used to describe the sub-phases of M phase. Although Figs. 11(c,f) show reduced ability to distinguish between the different sub-phases of the M phase compared to the results shown in Fig. 8(c) due to reduction in the sampling time of the additional cells (from two frames per minute to a frame per two minutes), the sub-phases can still be discerned.
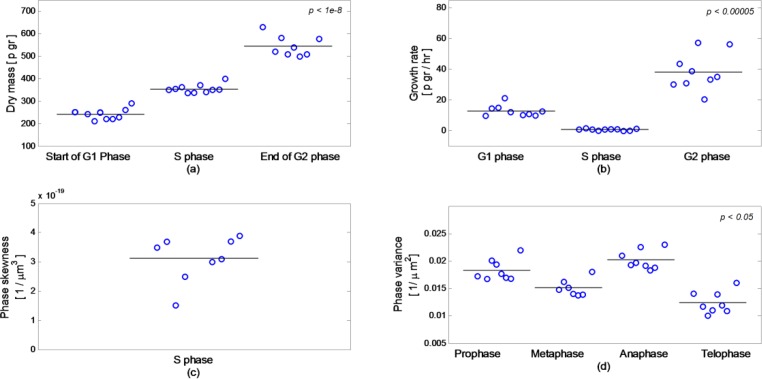
Figure 12 presents the combined results of four measurements done on all ten cells. Note that in some cases, we neglected up to two values due a measurement error or due to a lack of data. Figure 12(a) shows the dry mass values at the beginning of the G1 phase, mean value during S phase and the value in the end of the G2 phase, with the results of 241.1 ± 24.7 pgr at the beginning of G1 phase, 355 ± 19.21 pgr during S phase and 546 ± 45.75 pgr in the end of G2 phase. All of the values are well separated and have similar values per phase, and due to this can be used for discrimination of the different lifecycle phases. In all of the cases, the dry mass before division is double the dry mass in the beginning of G1 phase.
Fig. 12.
Combined measurements on 10 cells: (a) Dry mass; (b) Growth rate;(c) Phase skewness during S phase; (d) Phase variance during M phase. Each circle represents a value for a different cell. Horizontal line represents the average of all values in each group. In some cases, we neglected up to two values due a measurement error or due to a lack of data. All p values are found by Wilcoxon test.
Figure 12(b) presents the growth rate of the cell at each of the phases, with the results of G1 = 12.81 ± 3.63 pgr/hr, S = 0.76 ± 0.52 pgr/hr and G2 = 38.38 ± 12.26 pgr/hr. All of the cells have similar behaviors during the G1 and S phases, as expected. During the G2 phase, we see higher variability in the cells growth rate, but the end values of dry mass are similar in all of the cells. In most cases, the growth rate during the G2 phases was higher than during the G1 phases, and in the individual cell level, it was consistently higher.
Figure 12(c) shows the values of phase skewness during the S phase. All of the values show a similar behavior in G1 and S phases, as presented in Figs. 8(b), 11(b,e). Figure 12(d) presents the phase variance values at the different sub-phases, with the results of 0.0183 ± 0.0019 µm−2 for prophase, 0.0151 ± 0.0015 µm−2 for metaphase, 0.0202 ± 0.0018 µm−2 for anaphase and 0.0124 ± 0.002 µm−2 for telophase. Furthermore, the relative values for the sub-phases always had the same ratio.
The dry mass measurements in Fig. 5(a) combined with the statistical parameters in Figs. 8(a-c) can be used to better distinguish the different phases of the cell cycle and to describe the growth and rate at each of the phases. The different growth rate at each of the lifecycle phases describes the specificity of these phases and the processes occurring during the phases.
From Fig. 5(b), the cell reduces its mass density to a low constant value, potentially in order to improve the absorption capacity of materials within the cell. This corresponds with the visual OPD profiles of the cell in Figs. 3, 7, 9 and Media 1 (3.9MB, MPG) . Similar behavior is seen in the phase surface area to volume ratio in Fig. 6(c), as discussed previously in this study.
6. Conclusions
We have proposed interferometric-phase-based parameters that can be used for biological investigation of live cells in a label-free manner. Per sample instance, all of the parameters can be calculated using a single interferogram, without the need to decouple refractive index and thickness from the quantitative phase measurement, and thus can be used on heterogeneous refractive-index cells. The use of a single interferogram improves temporal resolution of acquisition and enables the use of the analysis tools for monitoring fast dynamic cell behaviors.
We have gathered generalized phase-based parameters with the potential abilities to describe biological phenomena in cells. We have also demonstrated that the phase-based parameters can provide a new way to investigate cell growth regulation, distinguish between controlled or linear growth, and describe the relationship between cell growth and size.
Some of the measured parameters presented here are used today as is in biology, such as cell dry mass and surface area. Other parameters are newly defined as generalized versions of biologically-relevant parameters without the need to decouple refractive index and thickness from the quantitative phase measurements.
Since the method does not require any intervention such as exogenous labeling, the cells could live for a long time during and even after the experiment, enabling long and efficient investigations on the cells. We thus expect that the tools presented in this paper will leverage the use of IPM for biological cell investigations due to their applicability for other types of cell structures and dynamics.
Acknowledgments
Supported by the Israel Science Foundation (ISF) Bikura grant.
References and links
- 1.N. T. Shaked, L. L. Satterwhite, M. T. Rinehart, and A. Wax, “Quantitative analysis of biological cells using digital holographic microscopy,” in Holography, Research and Technologies, J. Rosen, ed. (InTech, 2011), pp. 219–236. [Google Scholar]
- 2.Popescu G., Ikeda T., Best C. A., Badizadegan K., Dasari R. R., Feld M. S., “Erythrocyte structure and dynamics quantified by Hilbert phase microscopy,” J. Biomed. Opt. 10(6), 060503 (2005). 10.1117/1.2149847 [DOI] [PubMed] [Google Scholar]
- 3.Rappaz B., Barbul A., Emery Y., Korenstein R., Depeursinge C., Magistretti P. J., Marquet P., “Comparative study of human erythrocytes by digital holographic microscopy, confocal microscopy, and impedance volume analyzer,” Cytometry A 73A(10), 895–903 (2008). 10.1002/cyto.a.20605 [DOI] [PubMed] [Google Scholar]
- 4.Kemper B., Bauwens A., Vollmer A., Ketelhut S., Langehanenberg P., Müthing J., Karch H., von Bally G., “Label-free quantitative cell division monitoring of endothelial cells by digital holographic microscopy,” J. Biomed. Opt. 15(3), 036009 (2010). 10.1117/1.3431712 [DOI] [PubMed] [Google Scholar]
- 5.Rappaz B., Marquet P., Cuche E., Emery Y., Depeursinge C., Magistretti P. J., “Measurement of the integral refractive index and dynamic cell morphometry of living cells with digital holographic microscopy,” Opt. Express 13(23), 9361–9373 (2005). 10.1364/OPEX.13.009361 [DOI] [PubMed] [Google Scholar]
- 6.Choi W., Fang-Yen C., Badizadegan K., Oh S., Lue N., Dasari R. R., Feld M. S., “Tomographic phase microscopy,” Nat. Methods 4(9), 717–719 (2007). 10.1038/nmeth1078 [DOI] [PubMed] [Google Scholar]
- 7.Charrière F., Marian A., Montfort F., Kuehn J., Colomb T., Cuche E., Marquet P., Depeursinge C., “Cell refractive index tomography by digital holographic microscopy,” Opt. Lett. 31(2), 178–180 (2006). 10.1364/OL.31.000178 [DOI] [PubMed] [Google Scholar]
- 8.Kemper B., Carl D., Schnekenburger J., Bredebusch I., Schäfer M., Domschke W., von Bally G., “Investigation of living pancreas tumor cells by digital holographic microscopy,” J. Biomed. Opt. 11(3), 034005 (2006). 10.1117/1.2204609 [DOI] [PubMed] [Google Scholar]
- 9.Lue N., Popescu G., Ikeda T., Dasari R. R., Badizadegan K., Feld M. S., “Live cell refractometry using microfluidic devices,” Opt. Lett. 31(18), 2759–2761 (2006). 10.1364/OL.31.002759 [DOI] [PubMed] [Google Scholar]
- 10.Barer R., “Interference microscopy and mass determination,” Nature 169(4296), 366–367 (1952). 10.1038/169366b0 [DOI] [PubMed] [Google Scholar]
- 11.Popescu G., Park Y. K., Lue N., Best-Popescu C., Deflores L., Dasari R. R., Feld M. S., Badizadegan K., “Optical imaging of cell mass and growth dynamics,” Am. J. Physiol. Cell Physiol. 295(2), C538–C544 (2008). 10.1152/ajpcell.00121.2008 [DOI] [PMC free article] [PubMed] [Google Scholar]
- 12.Shaked N. T., Finan J. D., Guilak F., Wax A., “Quantitative phase microscopy of articular chondrocyte dynamics by wide-field digital interferometry,” J. Biomed. Opt. 15(1), 010505 (2010). 10.1117/1.3290242 [DOI] [PMC free article] [PubMed] [Google Scholar]
- 13.Shaked N. T., Satterwhite L. L., Bursac N., Wax A., “Whole-cell-analysis of live cardiomyocytes using wide-field interferometric phase microscopy,” Biomed. Opt. Express 1(2), 706–719 (2010). 10.1364/BOE.1.000706 [DOI] [PMC free article] [PubMed] [Google Scholar]
- 14.Weitzman J. B., “Growing without a size checkpoint,” J. Biol. 2(1), 3 (2003). 10.1186/1475-4924-2-3 [DOI] [PMC free article] [PubMed] [Google Scholar]
- 15.Popescu G., “Quantitative phase imaging of nanoscale cell structure and dynamics,” Methods Cell Biol. 90, 87–115 (2008). 10.1016/S0091-679X(08)00805-4 [DOI] [PubMed] [Google Scholar]
- 16.Moon I., Daneshpanah M., Anand A., Javidi B., “Cell identification computational 3-D holographic microscopy,” Opt. Photon. News 22(6), 18–23 (2011). 10.1364/OPN.22.6.000018 [DOI] [Google Scholar]
- 17.Wang Z., Millet L. J., Mir M., Ding H., Unarunotai S., Rogers J. A., Gillette M. U., Popescu G., “Spatial light interference microscopy (SLIM),” Opt. Express 19(2), 1016–1026 (2011). 10.1364/OE.19.001016 [DOI] [PMC free article] [PubMed] [Google Scholar]
- 18.D. C. Ghiglia and M. D. Pritt, Two-Dimensional Phase Unwrapping: Theory, Algorithms, and Software (Wiley, 1998). [Google Scholar]
- 19.Rappaz B., Cano E., Colomb T., Kühn J., Depeursinge C., Simanis V., Magistretti P. J., Marquet P., “Noninvasive characterization of the fission yeast cell cycle by monitoring dry mass with digital holographic microscopy,” J. Biomed. Opt. 14(3), 034049 (2009). 10.1117/1.3147385 [DOI] [PubMed] [Google Scholar]
- 20.Mir M., Wang Z., Shen Z., Bednarz M., Bashir R., Golding I., Prasanth S. G., Popescu G., “Optical measurement of cycle-dependent cell growth,” Proc. Natl. Acad. Sci. U.S.A. 108(32), 13124–13129 (2011). 10.1073/pnas.1100506108 [DOI] [PMC free article] [PubMed] [Google Scholar]
- 21.Mir M., Ding H., Wang Z., Reedy J., Tangella K., Popescu G., “Blood screening using diffraction phase cytometry,” J. Biomed. Opt. 15(2), 027016 (2010). 10.1117/1.3369965 [DOI] [PubMed] [Google Scholar]
- 22.Wadell H., “Volume, shape and roundness of quartz particles,” J. Geol. 43(3), 250–280 (1935). 10.1086/624298 [DOI] [Google Scholar]
- 23.Porter R. K., “Allometry of mammalian cellular oxygen consumption,” Cell. Mol. Life Sci. 58(5), 815–822 (2001). 10.1007/PL00000902 [DOI] [PMC free article] [PubMed] [Google Scholar]
- 24.G. J. Tortora and S. R. Grabowski, Principal of Anatomy and Physiology (Wiley, 2003). [Google Scholar]
- 25.Canham P. B., Burton A. C., “Distribution of size and shape in population of normal human normal red cells,” Circ. Res. 12, 405–422 (1968). [DOI] [PubMed] [Google Scholar]
- 26.Rao P. N., Engelberg J., “HeLa cells: effects of temperature on the life cycle,” Science 148(3673), 1092–1094 (1965). 10.1126/science.148.3673.1092 [DOI] [PubMed] [Google Scholar]
- 27.J. M. Mitchison, The Biology of the Cell Cycle (Cambridge University Press, 1971). [Google Scholar]
- 28.Kaufman R. J., “Overview of vector design for mammalian gene expression,” Methods Mol. Biol. 62, 287–300 (1997). [DOI] [PubMed] [Google Scholar]
- 29.Fisher H. W., Cooper T. W., “Electron microscope studies of the microvilli of HeLa cells,” J. Cell Biol. 34(2), 569–576 (1967). 10.1083/jcb.34.2.569 [DOI] [PMC free article] [PubMed] [Google Scholar]
- 30.Bista R. K., Uttam S., Wang P., Staton K., Choi S., Bakkenist C. J., Hartman D. J., Brand R. E., Liu Y., “Quantification of nanoscale nuclear refractive index changes during the cell cycle,” J. Biomed. Opt. 16(7), 070503 (2011). 10.1117/1.3597723 [DOI] [PMC free article] [PubMed] [Google Scholar]
- 31.G. M. Cooper, “The events of M phase,” in The Cell: A Molecular Approach (Sunderland, MA, Sinauer, 2000). [Google Scholar]
- 32.Boucrot E., Kirchhausen T., “Mammalian cells change volume during mitosis,” PLoS ONE 3(1), e1477 (2008). 10.1371/journal.pone.0001477 [DOI] [PMC free article] [PubMed] [Google Scholar]


