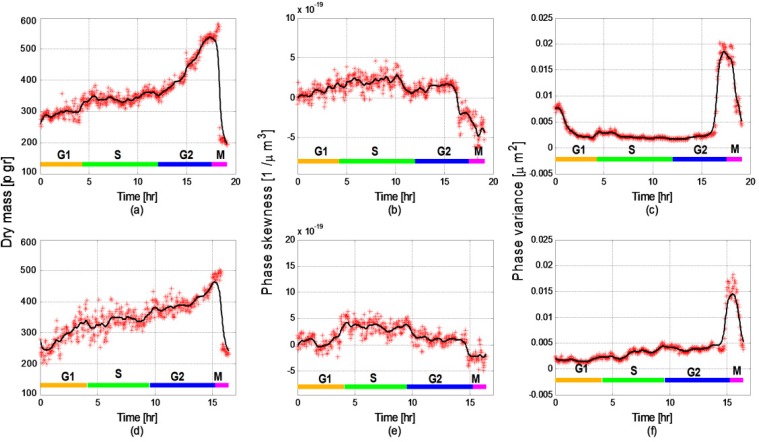
Fig. 11.
Three chosen parameters measured for two additional cells: (a,d) Dry mass (R2 = 0.9344 for the upper graph and R2 = 0.8961 for the lower graph); (b,e) Phase skewness (R2 = 0.87 for the upper graph and R2 = 0.8471 for the lower graph); (c) Phase variance (R2 = 0.9801 for the upper graph and R2 = 0.954 for the lower graph).

